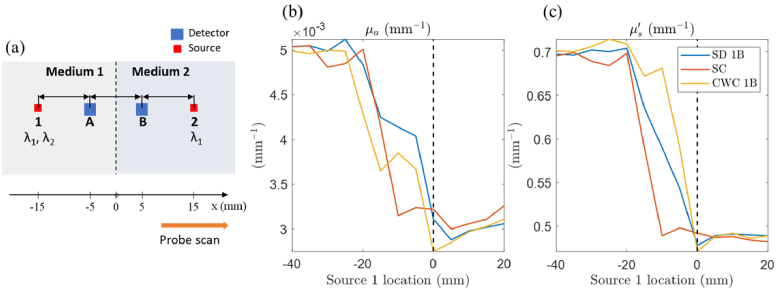
Fig. 7.
(a) Schematic diagram of a heterogeneous medium used for Monte Carlo simulation. The probe is shown positioned at the midpoint of the heterogeneous medium, which is the boundary of two separate homogeneous media. The sources are numbered (1 and 2), and the detectors are labeled with letters (A and B). Wavelength λ1 is used at both source 1 and 2 positions to calculate the cross-wavelength calibration factor for λ2. (b) and (c): Recovered optical properties µa and µs′ at wavelength λ2 obtained from three methods (single distance SD, self-calibration SC, and cross-wavelength calibration CWC), plotted relative to the source 1 locations with respect to the medium midline when moving the probe horizontally on the medium surface. The dashed line indicates the medium midline. SD and CWC methods were performed using measurements from source 1 and detector B.

