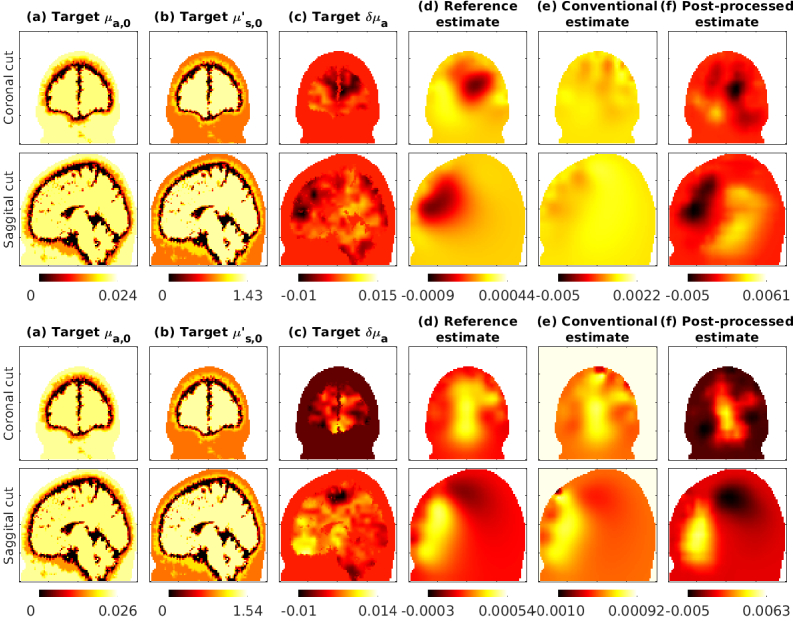
Fig. 5.
Subject 1 evaluation with 30% errors (top two rows) and 40% errors (bottom two rows). The post-processing network was trained with up to 40% errors. Coronal (top) and Saggital (bottom) views of parameters are shown. The columns show: (a) baseline target absorption coefficient, (b) scattering coefficient, and (c) change in absorption coefficient, followed by (d) reference estimate, (e) conventional estimate in presence of errors and (f) post-processed images.

