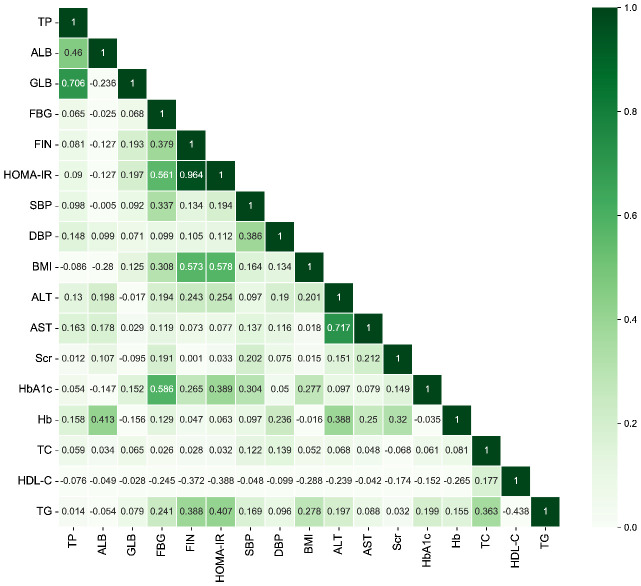
Figure 3.
The heatmap of the correlation between covariates using Spearman’s correlation analysis. TP, total protein; ALB, albumin; GLB, globulin; FBG, fasting blood-glucose; FIN, fasting insulin; HOMA-IR, homeostasis model assessment of insulin resistance; SBP, systolic blood pressure; DBP, diastolic blood pressure; BMI, body mass index; ALT, alanine aminotransferase; AST, aspartate aminotransferase; Scr, serum creatinine; HbA1c, glycated hemoglobin A1c; Hb, hemoglobin; TC, total cholesterol; HDL-C, high-density lipoprotein cholesterol; TG, triglycerides.

