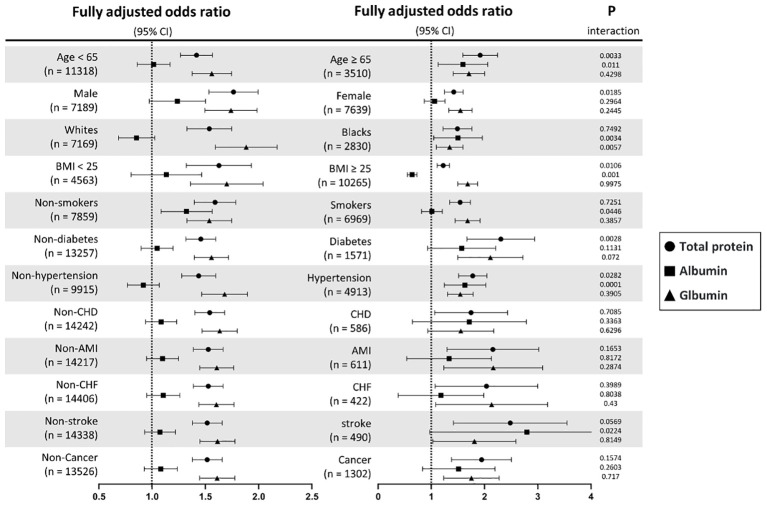
Figure 5.
Subgroup analyses of TP, ALB, and GLB with insulin resistance stratified by participant characteristics. TP, total protein; ALB, albumin; GLB, globulin; BMI, body mass index; CHD, coronary heart disease; AMI, acute myocardial infarction; CHF, chronic heart failure. Results are expressed as multivariable-adjusted odds ratio in continuous analyses (per 10g/L increment) after controlling covariates including age, gender, race, education, systolic blood pressure, diastolic blood pressure, body mass index, smoking, diabetes, hypertension, coronary heart disease, acute myocardial infarction, chronic heart failure, stroke, cancer, alanine aminotransferase, aspartate aminotransferase, serum creatinine, glycated hemoglobin A1c, hemoglobin, total cholesterol, high-density lipoprotein cholesterol, and triglycerides, where possible interactions between above factors are also adjusted for if necessary.

