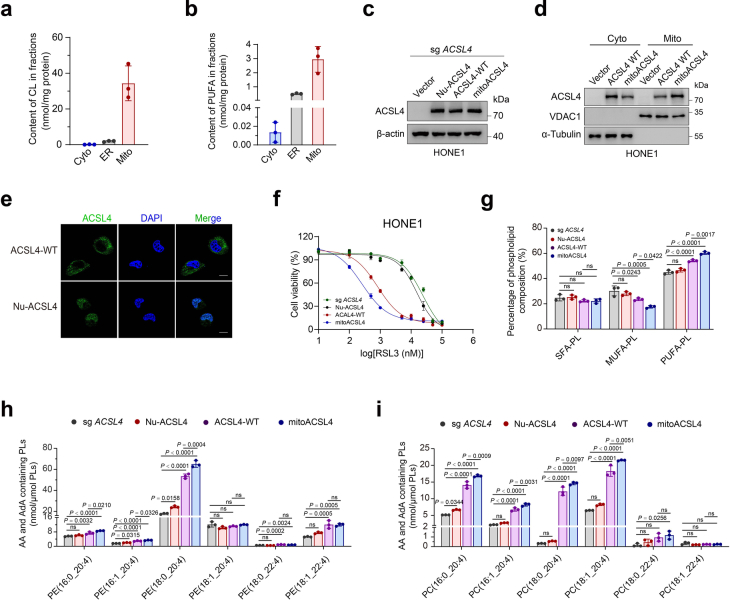
Extended Data Fig. 7. PCK2 increases cellular ferroptosis sensitivity via mitochondria located ACSL4.
a, Comparison between the levels of cardiolipin (CL) in the cytoplasm (Cyto), endoplasmic reticulum (ER) and mitochondria (Mito). b, The content of PUFA in the cytoplasm (Cyto), endoplasmic reticulum (ER) and mitochondria (Mito). c, Immunoblot analysis of ACSL4 expression in ACSL4-knockout (sg ACSL4) HONE1 cells stably expressing vector (Vector), human NLS-ACSL4 (Nu-ACSL4), human ACSL4 wild type (ACSL4-WT), or human mito-ACSL4 (mito-ACSL4). d, Immunoblots showing increased ACSL4 mitochondrial localization in ACSL4-knockout HONE1 cells stably expressing mitoACSL4 (mitoACSL4) compared to ACSL4 wild type overexpressing HONE1 cells (ACSL4 WT). Cyto, cytosol; Mito, mitochondrial. VDAC1 and α-Tubulin are markers for mitochondrial and cytosol, respectively. e, Representative immunofluorescence staining image showing the co-localization of ACSL4 (green) and Nucleus (blue) in the ACSL4-knockout HONE1 cells stably expressing human ACSL4 wild type (ACSL4-WT) or human NLS-ACSL4 (Nu-ACSL4). Scale bar: 10 μm. f, Dose-dependent toxicity of RSL3 of the cells depicted in ACSL4- knockout (sg ACSL4) HONE1 cells stably expressing vector (Vector), human NLS-ACSL4 (Nu-ACSL4), human ACSL4 wild type (ACSL4-WT) or human mito-ACSL4 (mito-ACSL4). g, The relative phospholipid composition changes of cells in ACSL4-knockout (sg ACSL4) HONE1 cells stably expressing vector (Vector), human NLS-ACSL4 (Nu-ACSL4), human ACSL4 wild type (ACSL4-WT) or human mito-ACSL4 (mito-ACSL4). P = 0.9910, 0.4435, 0.4162, 0.999997, 0.6996, 0.0243, 0.0005, 0.0422, 0.5183, 0.0000991, 0.00000209 and 0.00167. h, The content of esterified AA (C20:4) or AdA (C22:4) PE molecular species in cells in (i) are shown. P = 0.5369, 0.0032, 0.000073, 0.021, 0.0315, 0.0000190, 0.00000224, 0.0326, 0.0158, 0.000000079, 0.00000000851, 0.0004, 0.0991, 0.4924, 0.9986, 0.6389, 0.7626, 0.0002, 0.0024, 0.1500, 0.1951, 0.0005, 0.0005, 0.99994. i, The content of esterified AA (C20:4) or AdA (C22:4) PC molecular species in cells in (i) are shown. P = 0.0344, 0.000000134, 0.0000000163, 0.000947, 0.2556, 0.000000694, 0.0000000808, 0.0031, 0.9897, 0.0000000844, 0.00000002, 0.0097, 0.1196, 0.00000042, 0.000000063, 0.0051, 0.7878, 0.0856, 0.0256, 0.8973, 0.0966, 0.307, 0.311, 0.999999996. Data are shown as mean ± SD (a-b, g-i), one-way ANOVA (g-i), n = 3 independent experiments. One of three experiments is shown (c, d).

