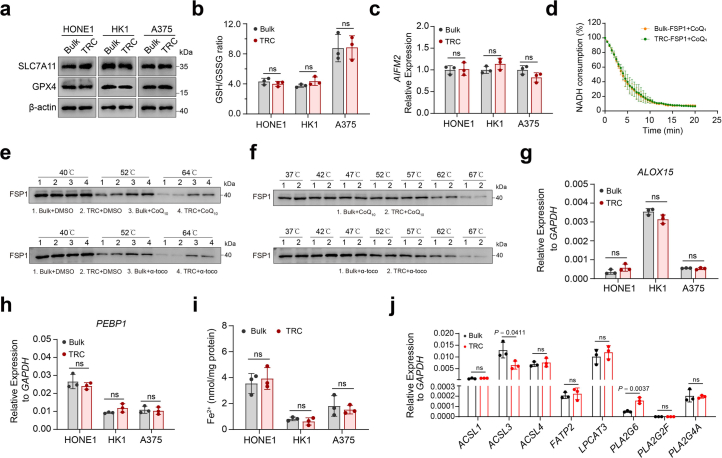
Extended Data Fig. 2. Interrogation the involvement of previously identified key genes in mediating resistance to ferroptosis in TRCs.
a, Immunoblots showing the expression of GPX4 and SLC7A11 in TRCs and bulk cells. b, GSH/GSSG ratios in TRCs and bulk cells. c, The relative mRNA expression of AIFM2 (encoding FSP1 protein) in TRCs and bulk tumor cells. d, NADH consumption assay with CoQ1 to determine the FSP1 activity. e, Representative results of a cellular thermal shift assay (CETSA). FSP1 protein was resistant to heat denaturation in the presence of CoQ10 (upper) and α-tocopherol (lower). f, Representative results of a cellular thermal shift assay (CETSA). FSP1 protein from HONE1 bulk tumor cells and TRCs showed similar heat denaturation in the presence of CoQ10 (upper) and α- tocopherol (lower). g-h, The relative mRNA expression of ALOX15 (i) or PEBP1(j) in TRCs and bulk tumor cells. P = 0.1556, 0.0683, 0.4532, 0.1007, 0.1243 and 0.7519. i, The cellular ferrous iron content of TRCs and bulk tumor cells was measured. P = 0.5932, 0.3396 and 0.6071. j, The relative mRNA expression of ACSL1, ACSL3, ACSL4, FATP2, LPCAT3, PLA2G6, PLA2G2F and PLA2G4A in TRCs and bulk tumor cells from HONE1 cells. Data are shown as mean ± SD, unpaired two-tailed t-test (b-c, g- j), n = 3 independent experiments. Bulk, black points; TRC, red points. One of three experiments is shown (a, e-f). ns, not significant.

