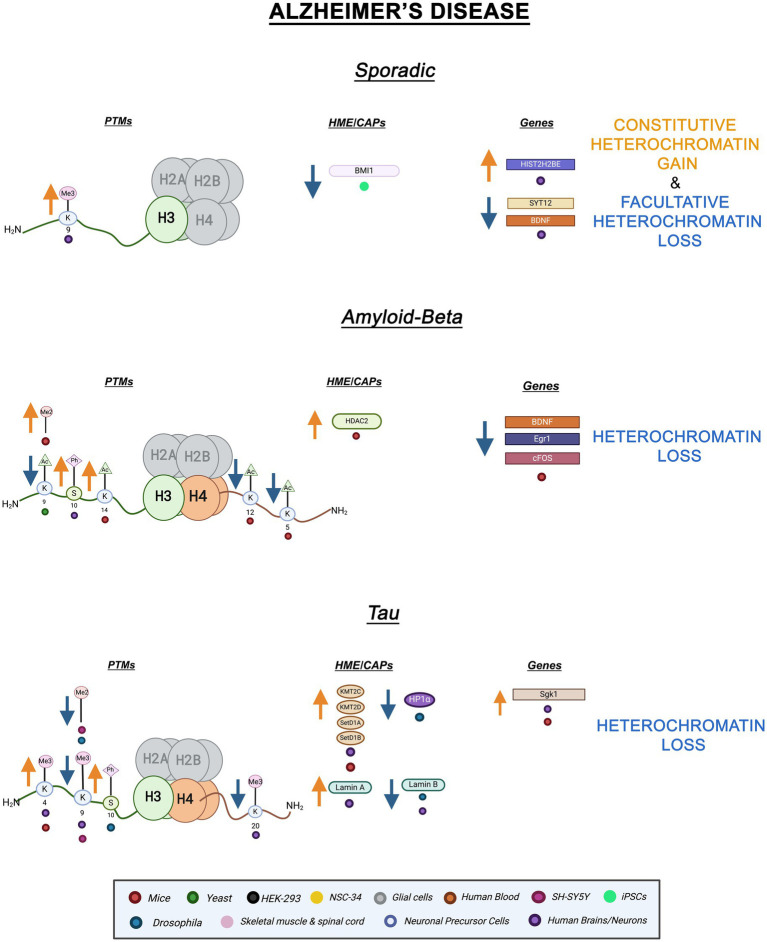
Figure 1.
Epigenetic alterations linked to sporadic and familial AD. Columns indicate histone post-translational modifications (PTMs), genes, histone-modifying enzymes (HMEs), and chromatin-associated proteins (CAPs) altered in AD. Yellow arrows denote increases in the levels of proteins, genes, or histone post-translational modifications, while blue arrows denote protein, gene, or post-translational modification level decreases. Colored dots indicate the model system as depicted in the legend. Global Heterochromatin gain is indicated in yellow font, while global heterochromatin loss is indicated in blue font. Figure created with Biorender.com.

