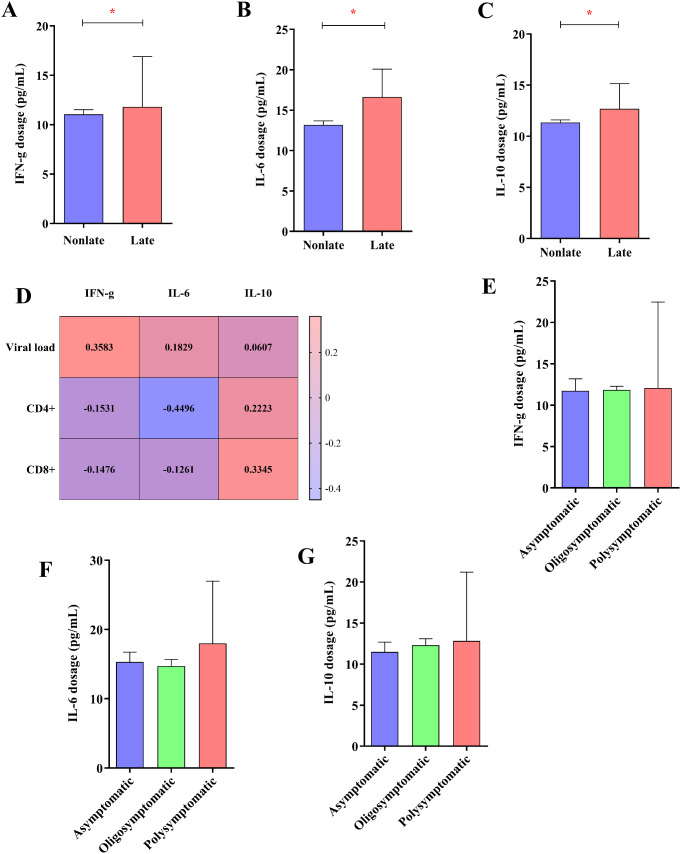
Fig. 4.
Cytokine dosage. Column graphs showing elevated levels of the cytokines IFN-ɣ (A), IL-6 (B) and IL-10 (C) in late and non-late presenters. (D) Heatmap showing the Spearman coefficients between the concentration of IFN-ɣ, IL-6 and IL-10, the HIV viral load, and the concentrations of CD4+ and CD8+ T lymphocytes (*: p < 0.005). Column graphs showing the concentrations of IFN-ɣ (E), IL-6 (F) and IL-10 (G) according to the grouping of symptoms of late presenters

