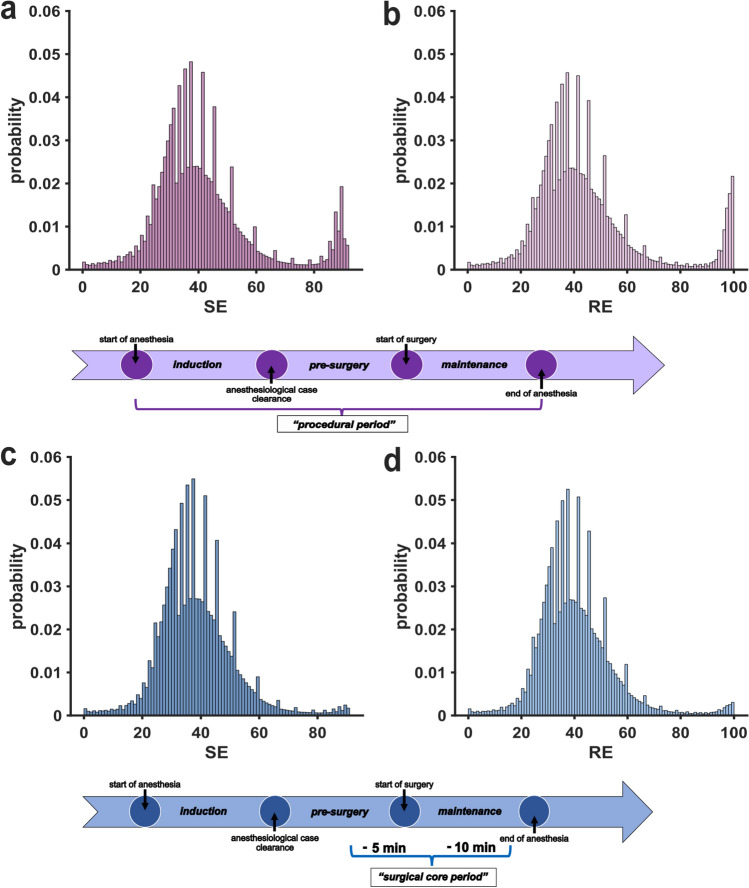
Fig. 1.
Histograms of state entropy (SE) and response entropy (RE) probability distributions for all age groups. Multiple index values show a distinctively higher probability compared to adjacent values and contrast the expected continuous index value distribution. Below the histogram, respective timelines indicate the relevant time points and periods. a Histogram of probabilities for SE index values during the procedural period. b Histogram of probabilities for RE index values during the procedural period. c Histogram of probabilities for SE index values during the surgical period. d Histogram of probabilities for RE index values during the surgical period

