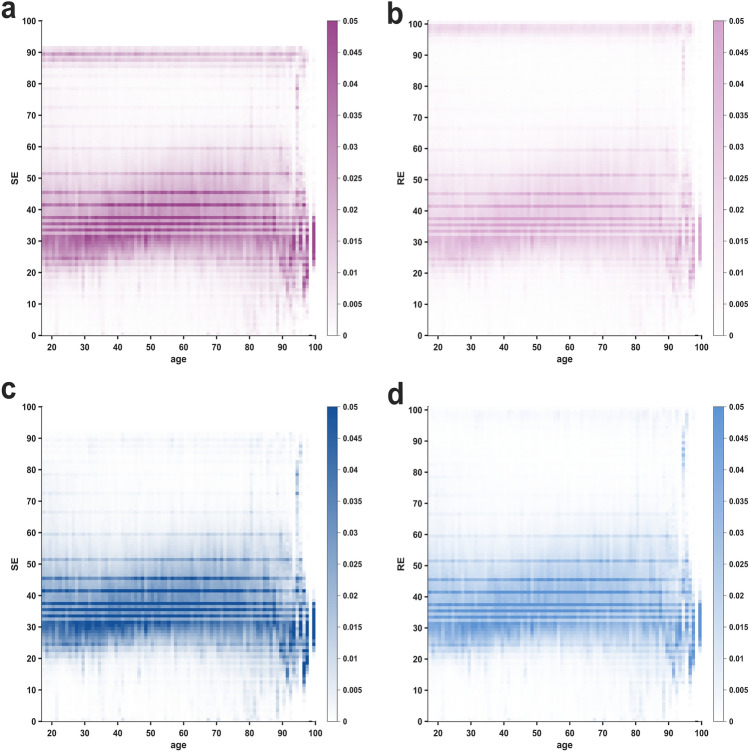
Fig. 2.
Heat maps of state entropy (SE) and response entropy (RE) probability distributions as a function of age. The horizontal, darkened lines indicate a distinctively higher probability occurrence for the respective SE and RE index values as well as a high consistency over the entire age range. Greater data dispersion in the age groups over 90 years is attributed to the limited sample size of patients above 90 years of age. a Heat map of SE index values during the procedural period. b Heat map of RE index values during the procedural period. c Heat map of SE index values during the surgical period. d Heat map of RE index values during the surgical period

