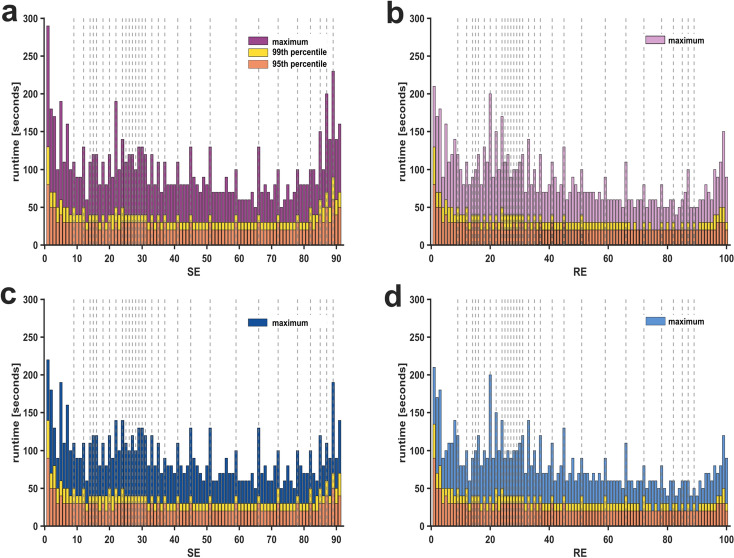
Fig. 4.
Maximum consecutive runtime spent in state entropy (SE) and response entropy (RE) values for the entire procedural period and the surgical period. The time spent in specific SE and RE index values indicated as consecutive runs with 10-second epochs per run. Maximum time spent, 99th, and 95th percentile are displayed separately. The previously identified pillar index values are highlighted with vertical grey dotted lines. a Consecutive runs of SE indices in the procedural period. b Consecutive runs of RE indices in the procedural period. c Consecutive runs of SE indices in the surgical period. d Consecutive runs of RE indices in the surgical period

