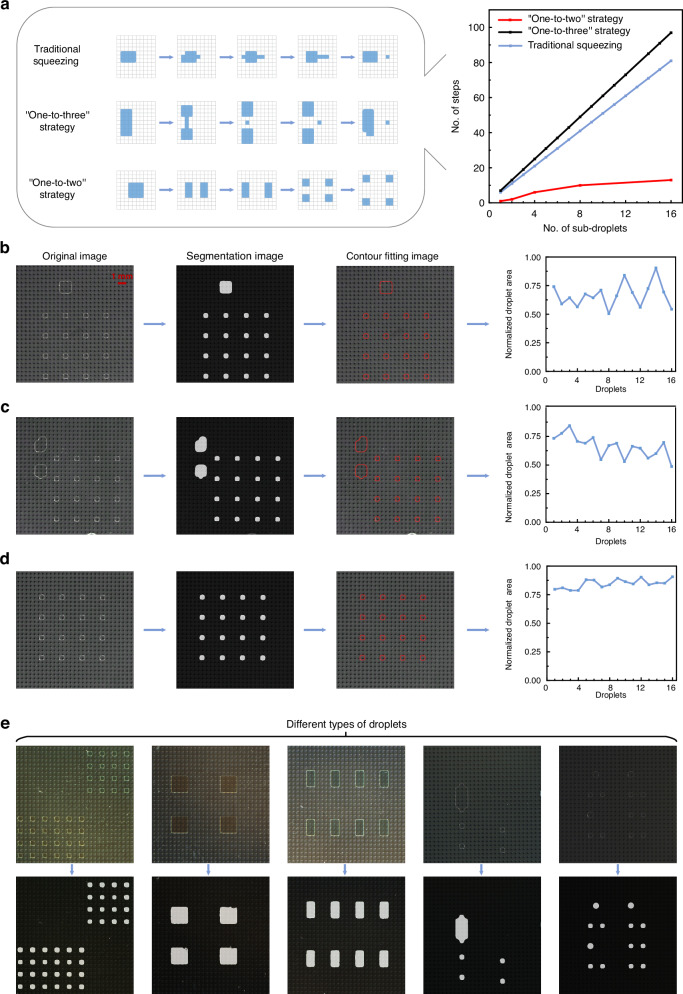
Fig. 2. Performance analysis of different droplet generation strategies.
a Schematic diagrams of the droplet generation processes implemented via the traditional squeezing, “one-to-three” strategy, and “one-to-two” strategy, as well as a graph showing the number of steps versus the number of subdroplets. b The original image, segmentation image, and contour-fitting image produced when performing droplet generation with the traditional squeezing and an area of 16 droplets. c The original image, segmentation image, and contour-fitting image produced when performing droplet generation with the “one-to-three” strategy and an area of 16 droplets. d. The original image, segmentation image, and contour-fitting image produced when performing droplet generation with the “one-to-two” strategy and an area of 16 droplets. e Model generalizability testing results obtained for different types of droplets with different sizes, colors, morphologies, and brightness levels

