
Figure 3.
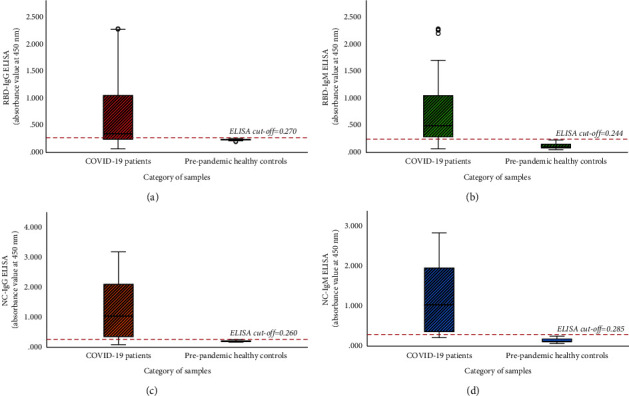
Comparison of ELISA values between COVID-19-infected patients and prepandemic healthy controls in (a) RBD-IgG ELISA, (b) RBD-IgM ELISA, (c) NC-IgG ELISA, and (d) NC-IgM ELISA. Boxes represent the interquartile interval, where 50% of the data was found.