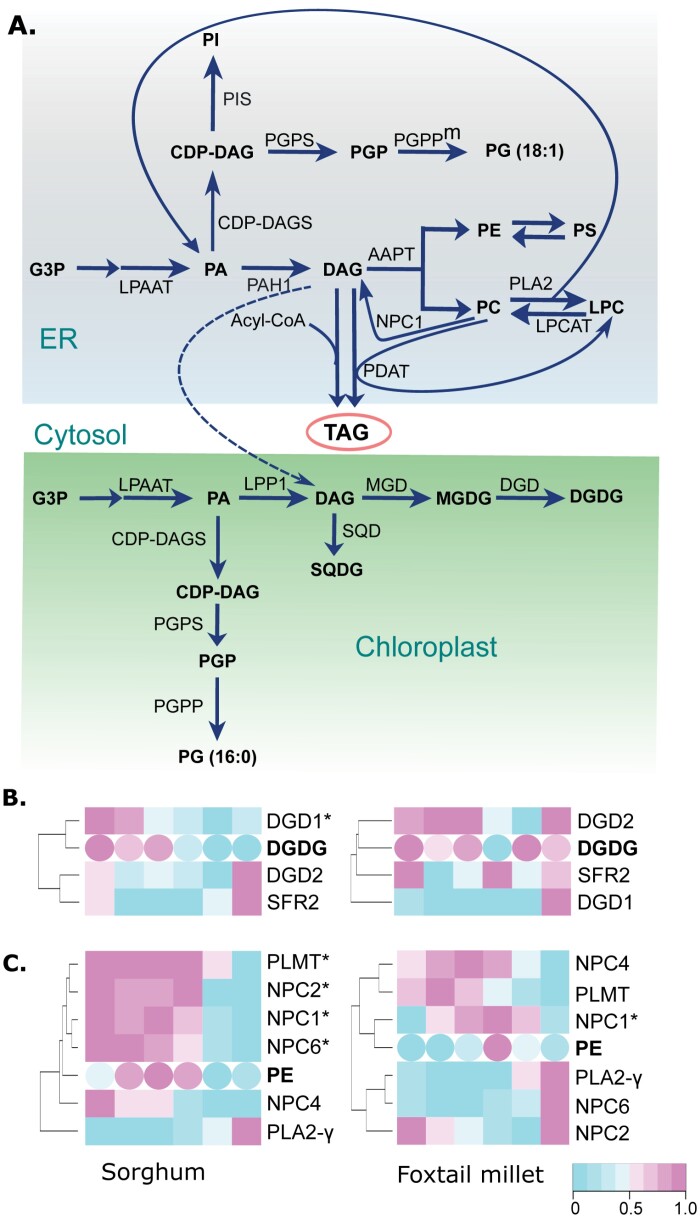
Fig. 4.
Correlation of lipid and transcript abundances in the glycerolipid biosynthesis pathway allows identification of candidate genes. (A) Diagram of the glycerolipid biosynthesis pathway, with lipid species shown in bold font and the enzymes responsible for each step denoted next to the corresponding arrows. (B, C) Heatmaps showing transcript abundance for candidate genes in lipid metabolism and abundance of lipid species (in bold) at different time points for DGDG (B) and phosphatidylethanolamine (PE) (C). Significant correlations, measured by Pearson correlation, between lipid changes and transcript abundance in either sorghum or foxtail millet are indicated by ‘*’ after the gene name.

