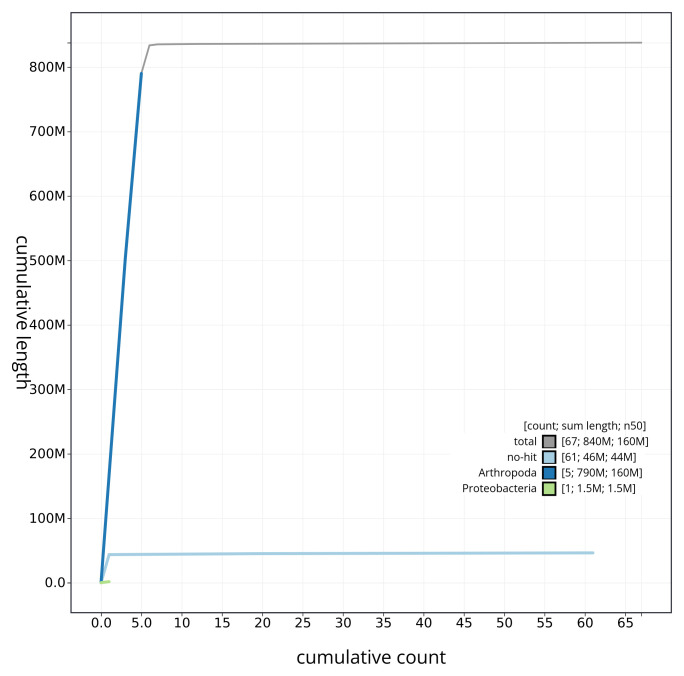
Figure 4. Genome assembly of Urophora cardui idUroCard1.1: BlobToolKit cumulative sequence plot.
The grey line shows cumulative length for all sequences. Coloured lines show cumulative lengths of sequences assigned to each phylum using the buscogenes taxrule. An interactive version of this figure is available at https://blobtoolkit.genomehubs.org/view/idUroCard1_1/dataset/idUroCard1_1/cumulative.

