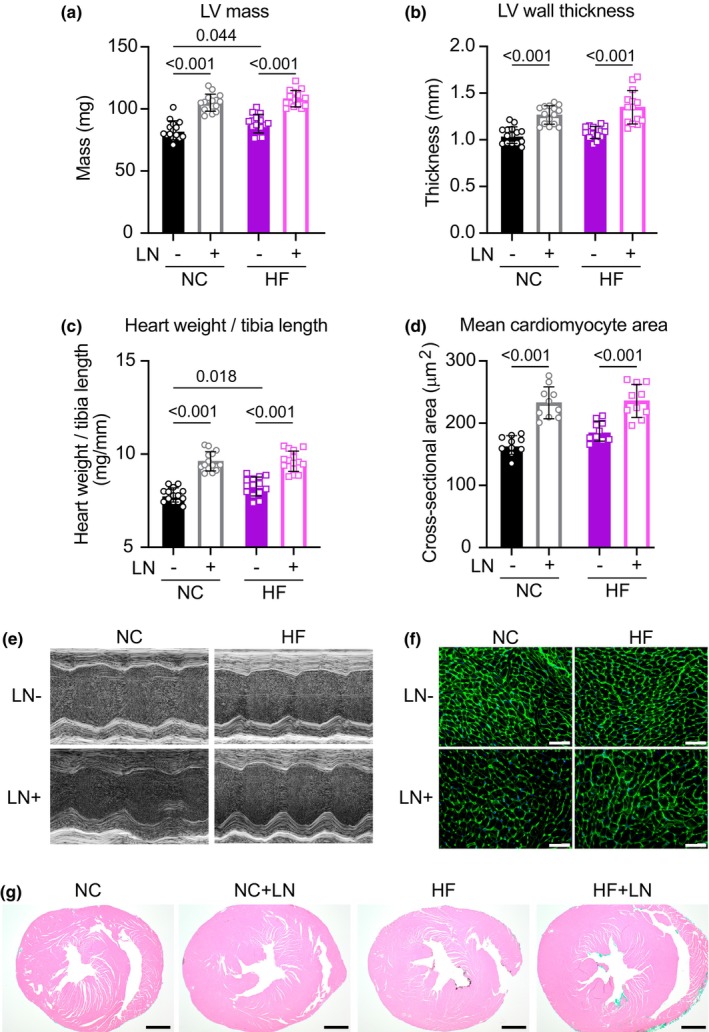
FIGURE 2.

Both hypertensive groups developed cardiac hypertrophy after 18 weeks of treatment, assessed by echocardiography (a, b, e), heart weight normalized to tibia length (c), average left‐ventricular cardiomyocyte cross‐sectional area (d, f; scale bars = 50 μm), and representative transverse cardiac cross‐sections stained with hematoxylin and eosin (g; scale bars = 200 μm). Panels (a–c): N = 15/group; (d): N = 10/group.
