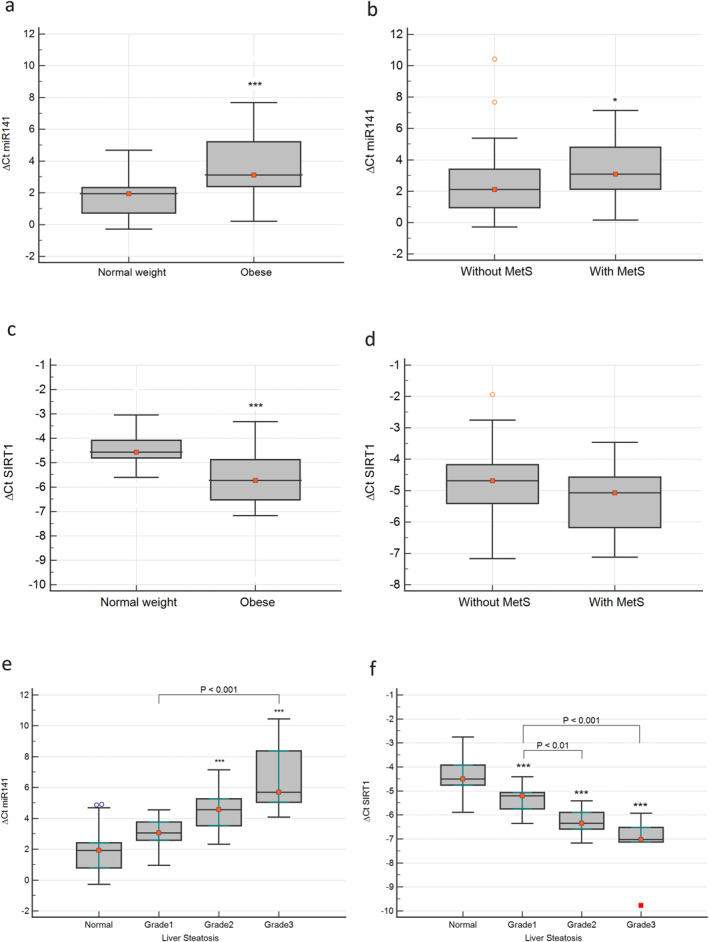
FIGURE 1.

Comparison of miR‐141 between the obesity and control groups (A), and the participants with or without metabolic syndrome (MetS) (B). Comparison of SIRT1 gene expression between the obesity and control groups (C), and the participants with or without MetS (D). The comparison of miR‐141 (E) and SIRT1 (F) gene expression of the different groups categorized based on the grade of liver steatosis. *p < 0.05, **p < 0.01, ***p < 0.001.
