
Figure 4.
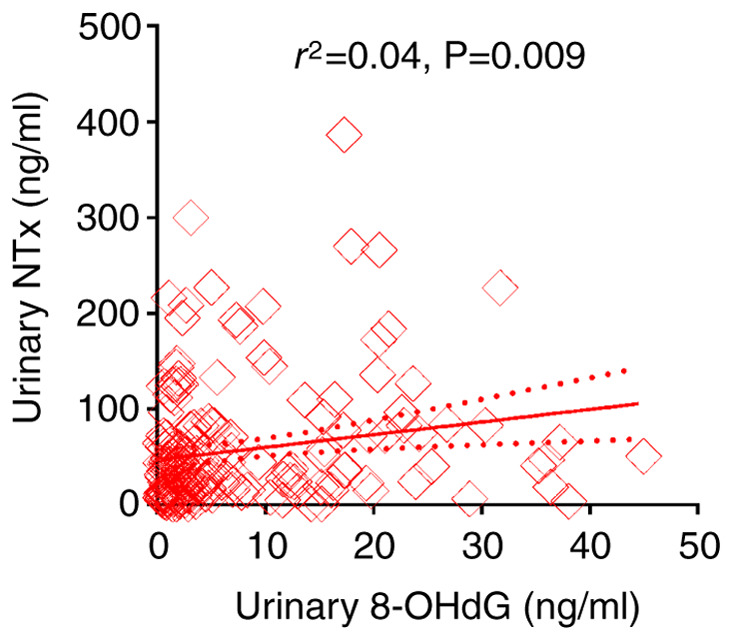
Association between NTx and 8-OHdG levels in the urine. The solid line represents the linear regression and the dotted lines represent the standard error. 8-OHdG, 8-hydroxydeoxyguanosine; NTx, N-terminal telopeptide.
Official websites use .gov
A
.gov website belongs to an official
government organization in the United States.
Secure .gov websites use HTTPS
A lock (
) or https:// means you've safely
connected to the .gov website. Share sensitive
information only on official, secure websites.
Association between NTx and 8-OHdG levels in the urine. The solid line represents the linear regression and the dotted lines represent the standard error. 8-OHdG, 8-hydroxydeoxyguanosine; NTx, N-terminal telopeptide.