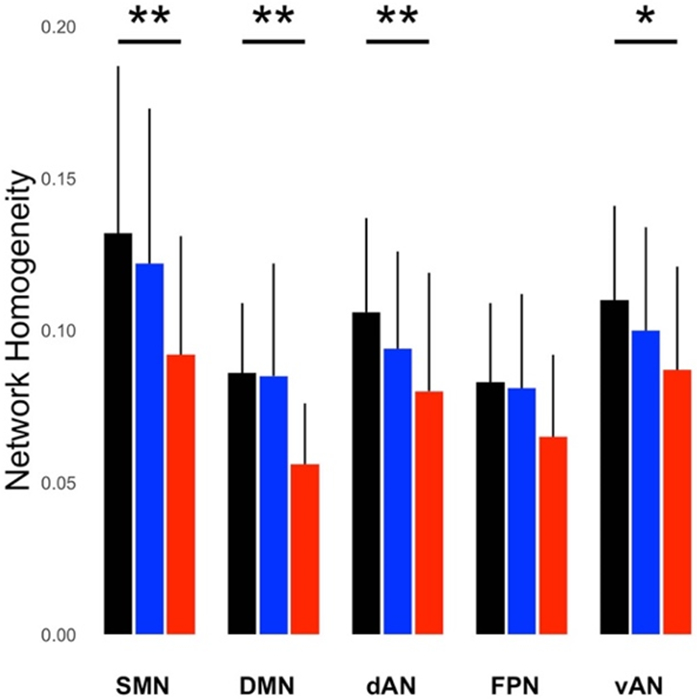
Figure 1.

Mean network homogeneity (NeHo) measures for five networks in healthy controls (black), presymptomatic C9+ carriers (blue), and symptomatic C9+ carriers (red), in a cross-sectional comparison using the last scan obtained from each person. NeHo is defined as the average correlation of all voxels within the network divided by the number of voxels in the network, using networks defined by Yeo et al (2011). NeHo was highest in healthy controls, followed by presymptomatic C9+ carriers, and symptomatic C9+ carriers. Asterisks indicate a significant linear relationship between diagnostic group and networks by Tukey’s post-hoc test (* p < 0.05, ** p < 0.01). dAN = dorsal attention network; DMN = default mode network; SMN = somatomotor network; vAN = ventral attention network; FPN = frontoparietal network. Bars show group means and SD.
