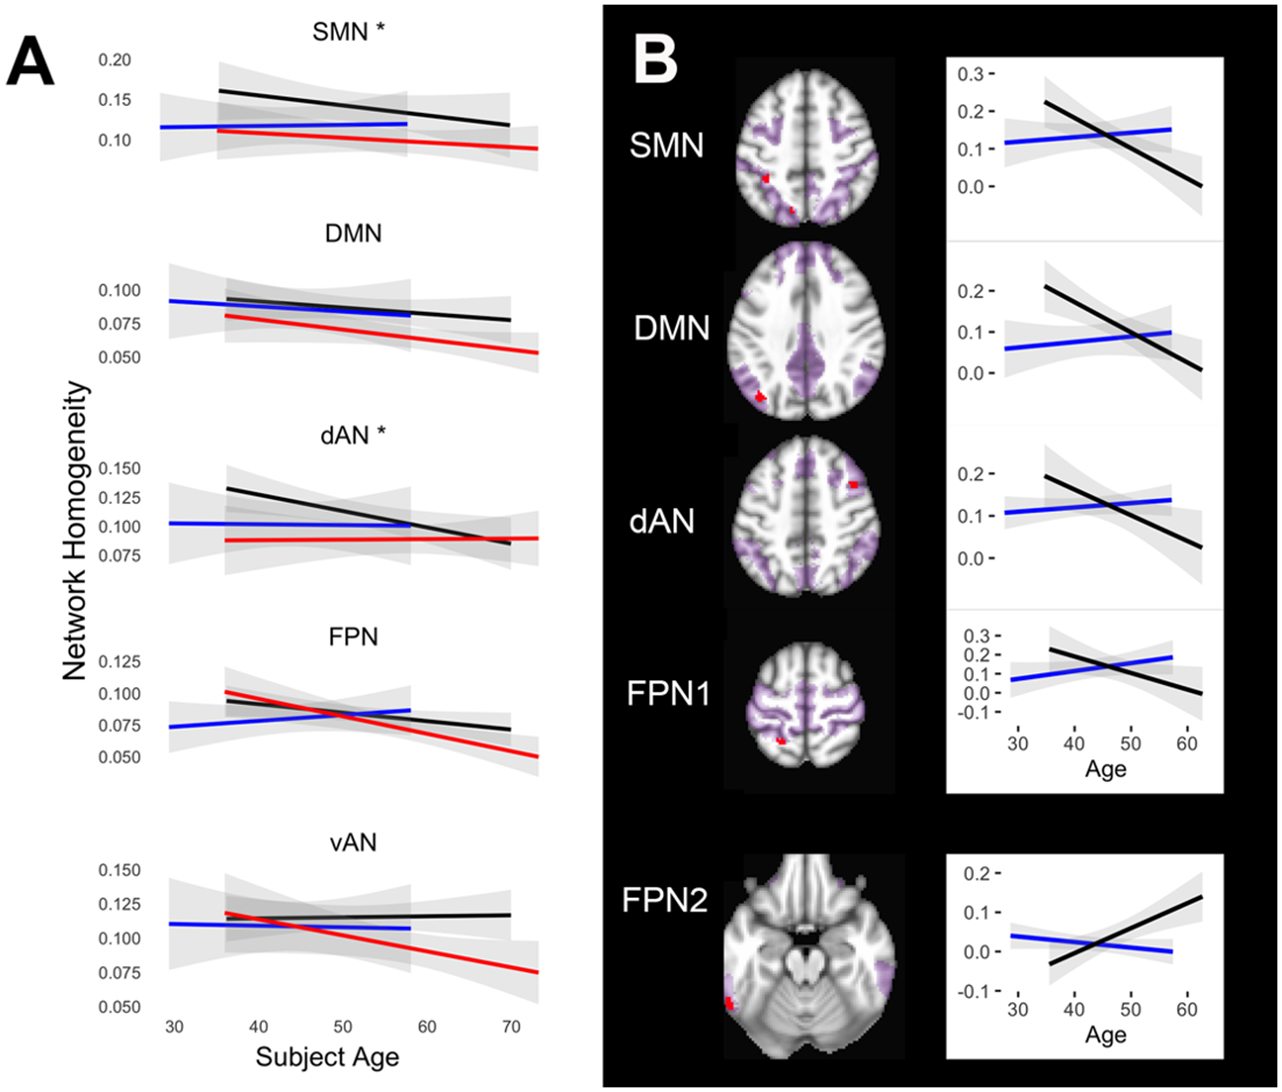
Figure 3.

Age-related changes in network homogeneity. A) Mean longitudinal trajectories of NeHo with age. Symptomatic C9+ carriers had reduced global homogeneity at all ages that continued to decline with age. Presymptomatic C9+ carriers diverged significantly from healthy controls in the somatomotor (SMN) and frontoparietal (FPN) networks. Black lines = healthy controls; red lines = symptomatic C9+ carriers; blue lines = presymptomatic C9+ carriers. Gray shading indicates 95% confidence interval, asterisks indicate networks with significant difference between groups (p < 0.05). B) Regions in networks in which the trajectory of changes in network homogeneity with age differed significantly between presymptomatic C9+ carriers (blue lines) and controls (black lines). Each graph shown with corresponding region in red to right (p < 0.05 FWE corrected). The top 4 graphs illustrate regions where presymptomatic carriers exhibited increasing homogeneity with age whereas controls declined. The bottom graph shows a region in the FPN (labeled FPN2) in which presymptomatic carriers had declining homogeneity but controls had increasing homogeneity. The extent of each network is shown in magenta. DMN = default mode network; dAN = dorsal attention network
