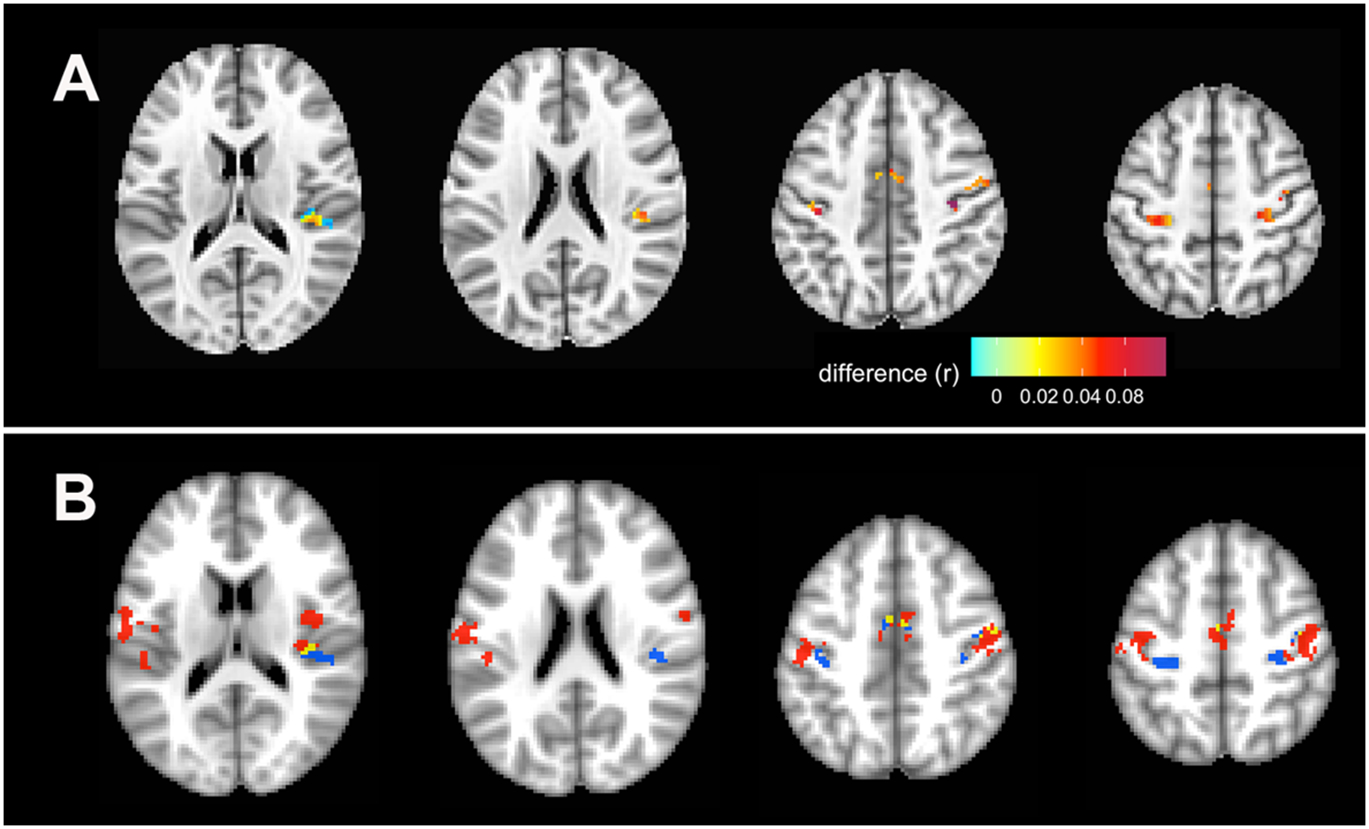
Figure 4.

Longitudinal increases in voxel-wise network homogeneity in the SMN in presymptomatic subjects. A) Regions with increasing network homogeneity (p < 0.05 FWE corrected). The color bar indicates the magnitude of the change in connectivity (r), with lighter colors indicating lesser change, and red indicating greater change. B) The same regions with increased network homogeneity as seen in panel A are shown here in blue to illustrate location of increased homogeneity in presymptomatic C9+ carriers relative to areas of decreased homogeneity in symptomatic C9+ carriers (red) at the time of their last scan, as in Figure 2. Yellow regions are areas of overlap.
