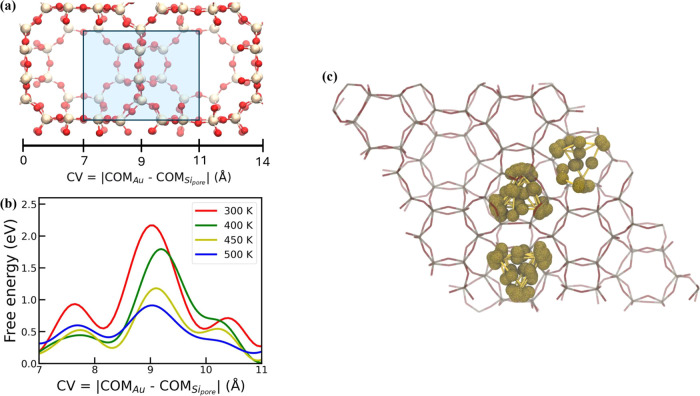
Figure 6.
(a) Positions of Au3@LTA zeolite in the CV space (the CV is defined in eq 1). The blue region shows the region where free energy surface was estimated. (b) The free energy surfaces (FES) of Au3@LTA at 300, 400, 450, and 500 K, respectively. (c) The pores occupied by an Au3 nanocluster in a CHA zeolite from a 10 ns MD simulation conducted at 500 K.

