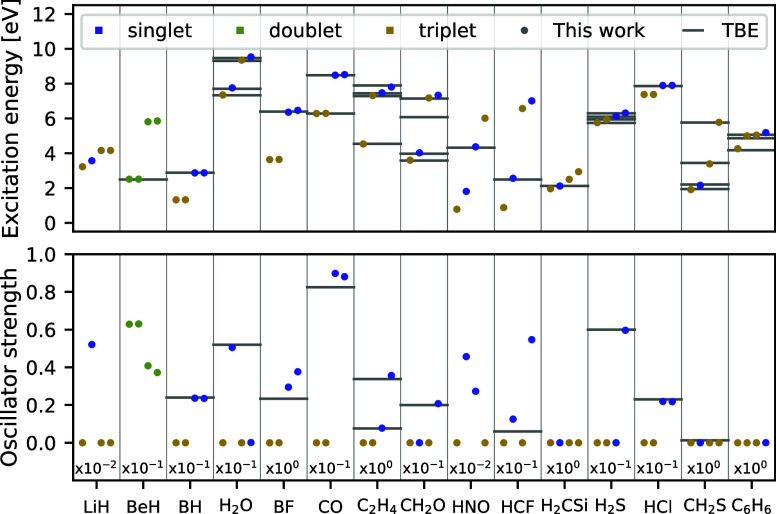
Figure 4.
Excitation energies and oscillator strengths of main-group molecules. Electronic excitation energies and oscillator strengths are computed for the lowest four transitions in a set of 15 molecules. Theoretical best estimates are depicted with gray horizontal lines where available,48 while the predictions of penalty-based VMC are displayed with dots, with colors denoting the spin of the corresponding excited state. Excitation energies are plotted on the top pane, while oscillator strengths are shown on the bottom pane.

