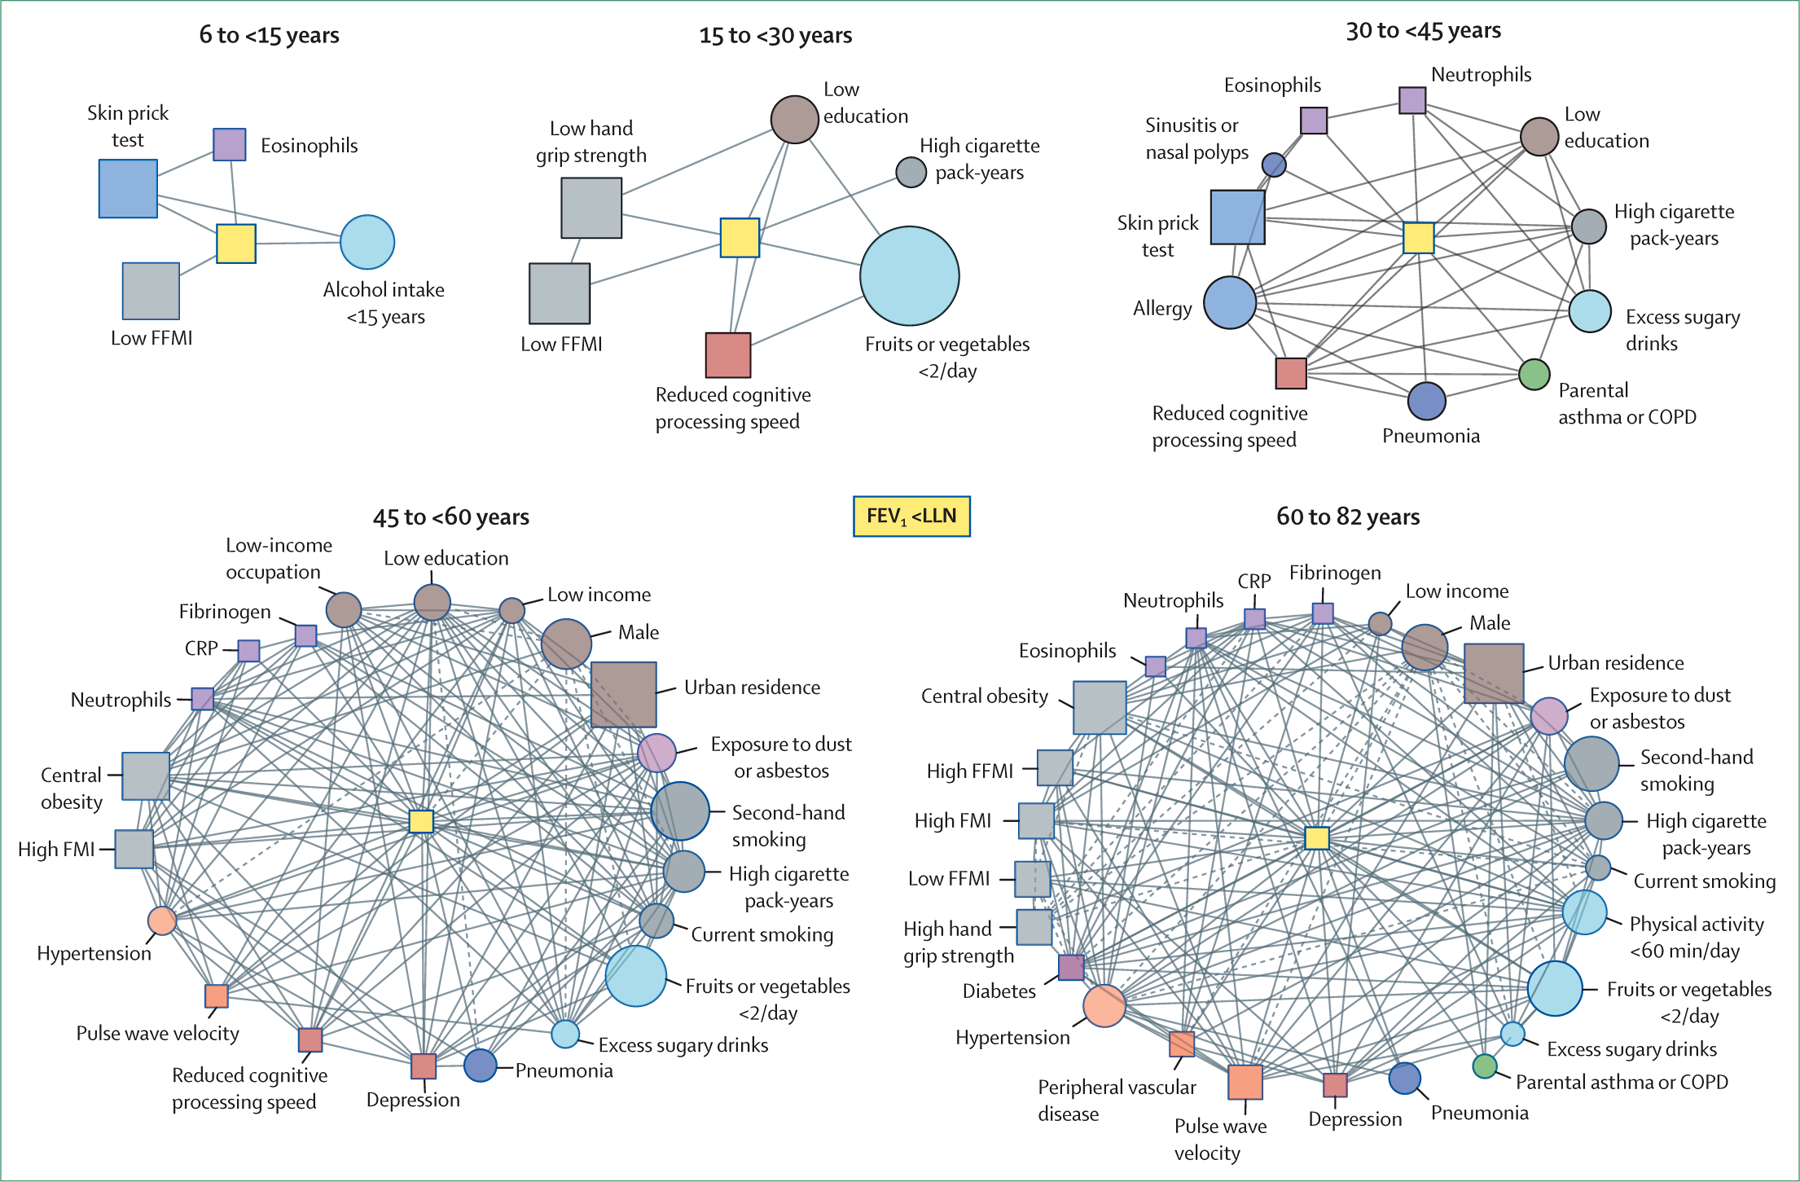
Figure 3: Network of interactions between risk factors for reduced lung function in different age bins.

Network of interactions between risk factors for reduced lung function—FEV1 less than LLN (central yellow nodes)—in different age bins. Each node represents one variable (squares indicate that the variable was directly quantified, circles indicate that the variable was determined using questionnaires), node size is proportional to the prevalence of that variable in the specific age group, and node colour corresponds to the variable category (eg, biomarkers in purple, nutrition and activity in light blue). Links between nodes indicate the existence of a significant (p<0·05) relationship between variables and the line type indicates whether the odds ratio is greater than 1 (continuous; positive association) or less than 1 (dashed; negative association).19 The complexity of the network of interactions increases with advancing age. Modified from Breyer-Kohansal and colleagues,19 by permission of the American Thoracic Society. COPD=chronic obstructive pulmonary disease. CRP=C-reactive protein. FFMI=fat-free mass index. FMI=fat mass index. LLN=lower limit of normal.
