Figure 2.
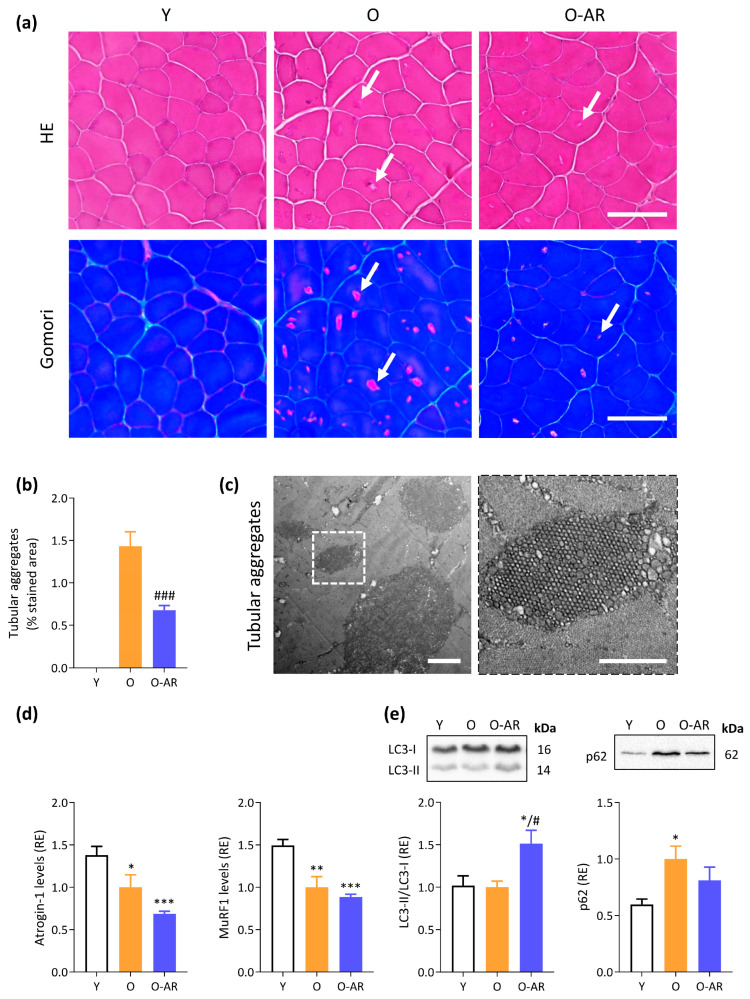
AdipoRon reduces age-related accumulation of tubular aggregates (TAgs). (a) TAgs (indicated by arrows) appear as pale or slightly basophilic inclusions with hematoxylin–eosin (HE) and bright pink ones with Gomori Trichrome on serial transversal cross-sections of TA from the three groups of mice (Y, O, and O-AR). Scale bars = 100 µm. (b) Quantification of TAg abundance after Gomori Trichrome was expressed as a % of stained area (i.e., bright pink inclusions areas normalized to the cross-sectional area of the muscle). (c) Characteristic honeycomb appearance of TAgs by transmission electron microscopy. Scale bar = 2 µm, Inset: higher magnification of a honeycomb TAg (scale bar = 1 µm). (d) Protein levels of Atrogin-1 and MURF1 were measured by ELISA. (e) LC3-II/LC3-I ratio and p62 were analyzed by Western blotting. p62 levels were normalized to Ponceau S staining (shown in Figure S4c,d). Results are presented as relative expression compared to O values (d,e). Data are means ± SEM for 6 Y, 6 O, and 9 O-AR. Statistical analysis was performed using unpaired two-tailed t-test to compare O and O-AR (b) or one-way ANOVA followed by Tukey’s test to compare the 3 groups of mice (d,e). * p < 0.05, ** p < 0.01, *** p < 0.001 vs. Y mice. # p < 0.05, ### p < 0.001 vs. O mice.

