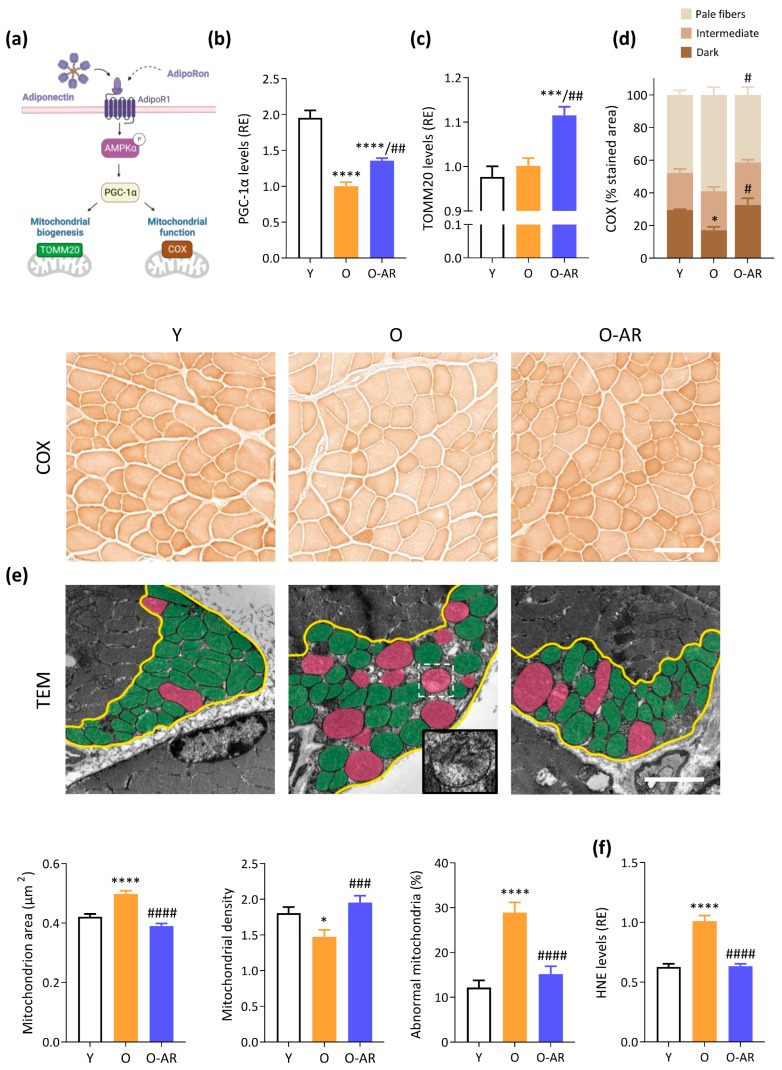
Figure 4.
AdipoRon enhances mitochondrial biogenesis and function. (a) Activation of the AMPK-PGC-1α signaling pathway by ApN stimulate mitochondrial biogenesis and function. TOMM20 is a marker of mitochondrial content, while COX activity reflects mitochondrial activity. Pointed arrows indicate activation or induction. (b) PGC-1α and (c) TOMM20 protein levels quantified by ELISA. (d) Quantification of COX activity in the TA from the three groups of mice (Y, O and O-AR) based on histochemistry staining, for which representative transversal cross-sectional images are shown after. Three staining intensities were defined as pale, intermediate, or dark, with the darkest color being associated with the highest activity. Activity was expressed as % of stained area (i.e., colored areas normalized to the cross-sectional area of the muscle). Scale bar = 100 µm. (e) Transmission electron micrographs (TEM) of mitochondria in the subsarcolemmal region of G (transversal cross-sections) in the 3 groups of mice (Y, O, and O-AR). The yellow line delimits the subsarcolemmal area. Abnormal mitochondria are false-colored in pink, while normal mitochondria are colored in green. Representative images of each group are shown. Scale bar = 2 µm. The mitochondrion area and the number of mitochondria per µm2 in the subsarcolemmal region were calculated based on TEM images. The percentage of abnormal mitochondria out of the total number of mitochondria was also calculated. In total, 1117, 1604, and 1435 subsarcolemmal mitochondria were sampled for Y, O, and O-AR group, respectively. (f) HNE protein levels were quantified by ELISA. (b,c,f) Absorbance data were presented as relative expression compared with O values. Data are means ± SEM for 6 Y, 6 O, and 9 O-AR (b–d,f). Statistical analysis was performed using one-way ANOVA followed by Tukey’s test to compare the 3 groups of mice. * p < 0.05, *** p < 0.001, **** p < 0.0001 vs. Y mice. # p < 0.05, ## p < 0.01, ### p < 0.001, #### p < 0.0001 vs. O mice.

