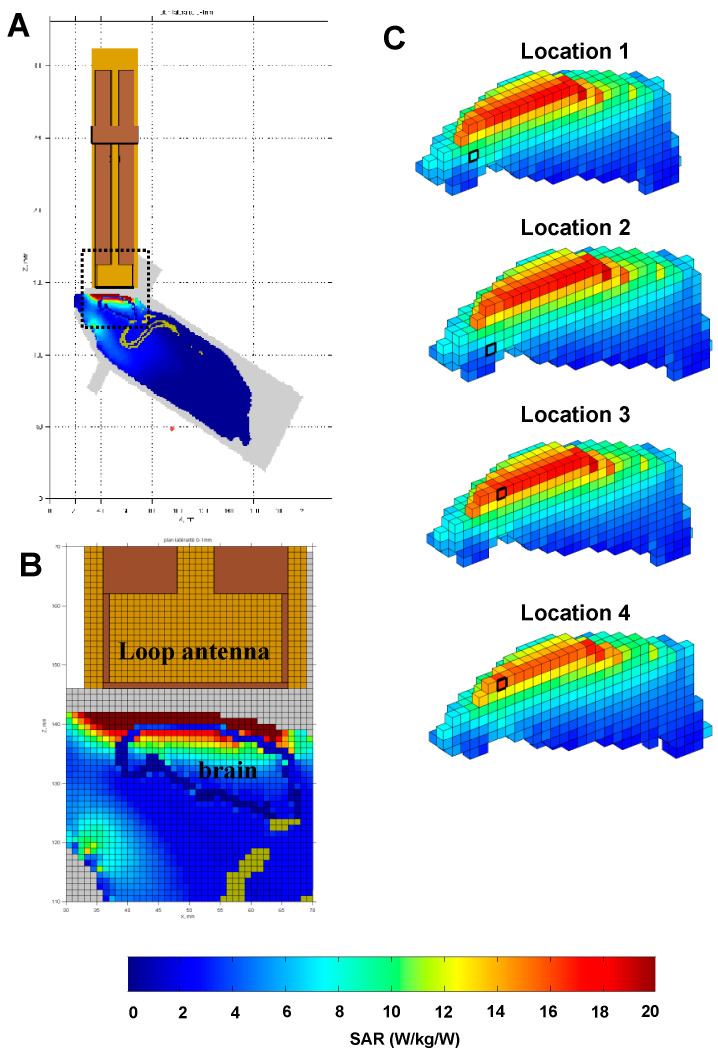
Figure 10.
Dosimetric analysis of specific absorption rates (SARs) in the rat brain during exposure to GSM 900 MHz. The heterogeneous model of rat phantom and loop antenna described by Lévêque et al. [51] was used to evaluate the local SAR in the brain with a 1 mm cubic mesh. As explained by Lévêque et al. [51], an MRI of an adult rat (250 g) maintained in the rocket was carried out, and the tissues (skin, skull, brain, marrow, fat, muscles) were segmented and assigned to different dielectric properties. (A) Global view of the rat phantom in the rocket with the loop antenna above its head. The area defined by the dotted line is shown in (B). (B) This view shows the interface between the loop antenna and the rat’s head. It clearly indicates that the first millimeters of tissue below the loop antenna (i.e., the skin, the skull, the dura mater, and the cortex) received the highest SAR values. (C) Based on the relative location of the brain areas in the Paxinos and Watson atlas [55] and on their corresponding locations in the model of the rat brain, values of SAR for the brain areas exhibiting changes in c-Fos labeling were evaluated. The locations 1, 2, 3, and 4 depicted here correspond to the position of the prelimbic, infralimbic, frontal M2, and frontal M1 areas, respectively. Note that the two frontal areas (M1 and M2) received high SAR values, whereas the prelimbic and infralimbic areas received low SAR values because they are located deeper in the brain. Despite this important difference in terms of SAR values, they all expressed changes in c-Fos labeling.

