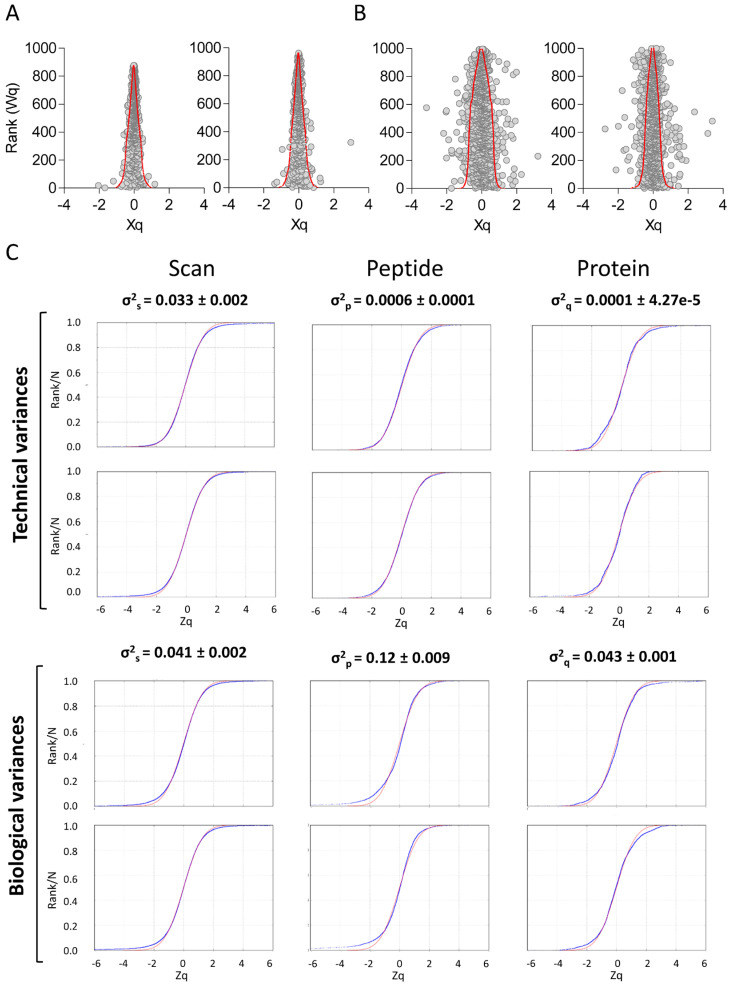
Figure 3.
Protein quantification accuracy of the large-scale proteomics workflow. (A) Average protein quantification values (grand-mean-corrected) from the same internal standard sample labeled with two different TMT reagents plotted against their ranked statistical weight. Red lines delimit the 95% confidence interval (two standard deviations). (B) Average protein quantification values (grand-mean-corrected) from two different biological samples plotted against their ranked statistical weight. Red lines delimit the 95% confidence interval (two standard deviations). (C) Technical and biological variances at the scan, peptide, and protein levels. Technical variance (top panel) was estimated using the quantification of the same internal standard labeled with two different TMT tags, whereas biological variance (bottom panel) was estimated by matching the quantification of one individual against the average of the internal standard sample (which was labeled with two different TMT tags). Variance values are expressed as average (from 14 and 56 experiments for technical and biological variance, respectively) ± SEM. SEM, standard error of the mean; TMT, tandem mass tags.

