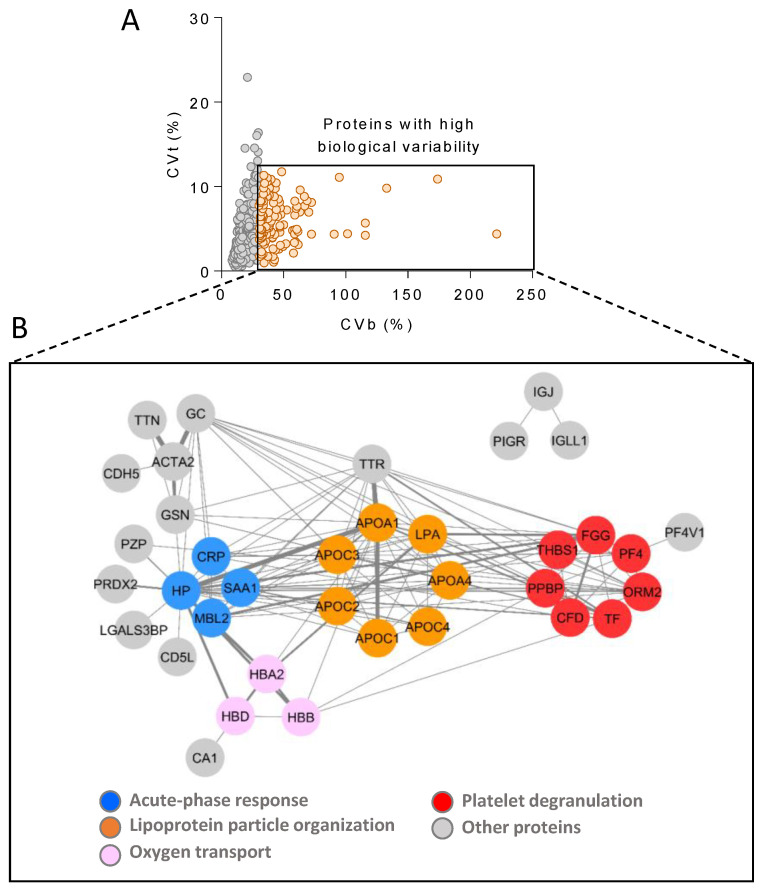
Figure 6.
Highly biologically variable proteins. (A) Analytical variability (CVt) was plotted versus biological variability (CVb) for proteins quantitated across at least 80% of the individuals at baseline. Proteins with CVt < 12 and CVb > 30 were considered to have high biological variability (orange dots). (B) Correlation network obtained with the highly biologically variable proteins. Edge line thickness is proportional to the strength of the association. The following functional categories were found enriched (FDR < 1%): acute-phase response (blue), lipoprotein particle organization (orange), oxygen transport (pink), and platelet degranulation (red). Additional highly biologically variable proteins are highlighted in gray. CVb, biological coefficient of variation; CVt, technical coefficient of variation; FDR, false discovery rate.

