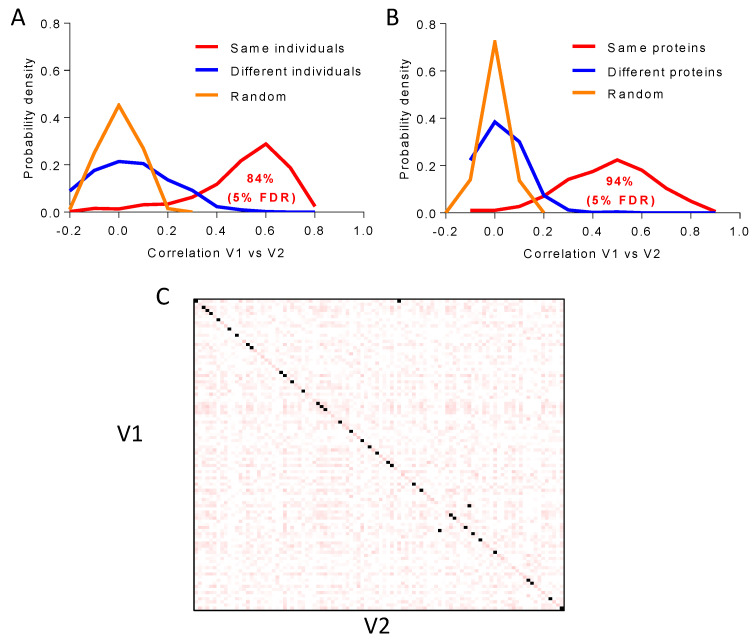
Figure 7.
Long-term stability of the plasma proteome. (A) Probability distribution of the Pearson correlation coefficient between plasma protein quantitative values at baseline (V1) and three years later (V2), showing statistically significant temporal intra-individual correlation (5% FDR) between protein quantitative values for 84% of the individuals (red line). No correlation was found between different (blue line) or random (orange line) individuals. (B) Probability distribution of the Pearson correlation coefficient between the plasma protein quantitative values at baseline (V1) and three years later (V2), showing statistically significant temporal intra-protein correlation (5% FDR) for 94% of the proteins quantitated across individuals (red line). No correlation was found between different (blue line) or random (orange line) proteins. (C) The Pearson correlation matrix of plasma proteins quantitated across 440 individuals (224 proteins) in V1 and V2. For most of the subjects (90%), intra-individual correlation was higher than that between proteins from different individuals. FDR, false discovery rate.

