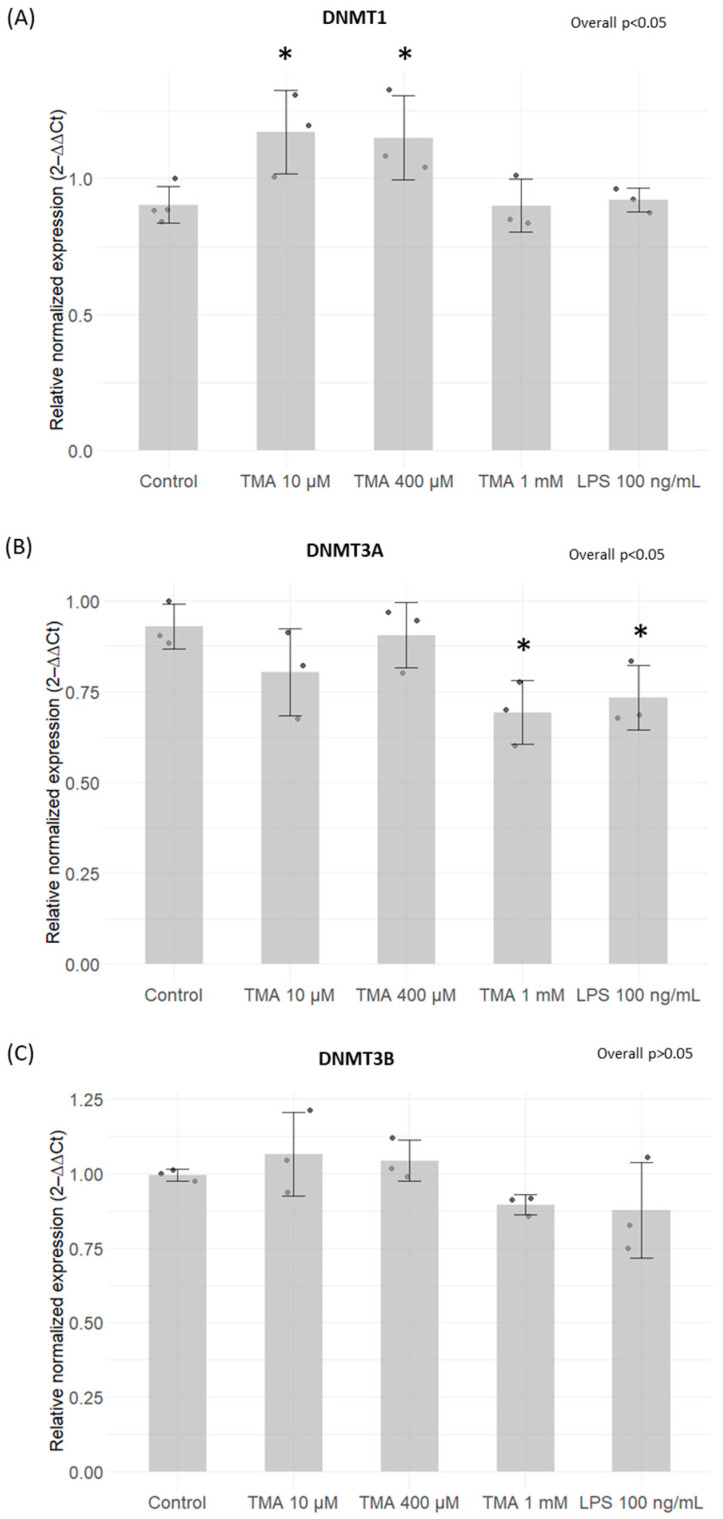
Figure 3.
Expression levels of DNMTs measured by qPCR. DNMT1 (A), DNMT3A (B) and DNMT3B (C) expression levels on Caco-2 cells after TMA treatments measured with the qPCR. A significant increase in DNMT1 expression was induced by TMA at 10 µM and 400 µM (A). A statistically significant decrease in DNMT3A expression was observed after exposure for 24 h to TMA at 1 mM and LPS at 100 ng/mL (B). DNMT3B expression remained unaffected by both TMA and LPS treatments (C). * p < 0.05 vs. Control.

