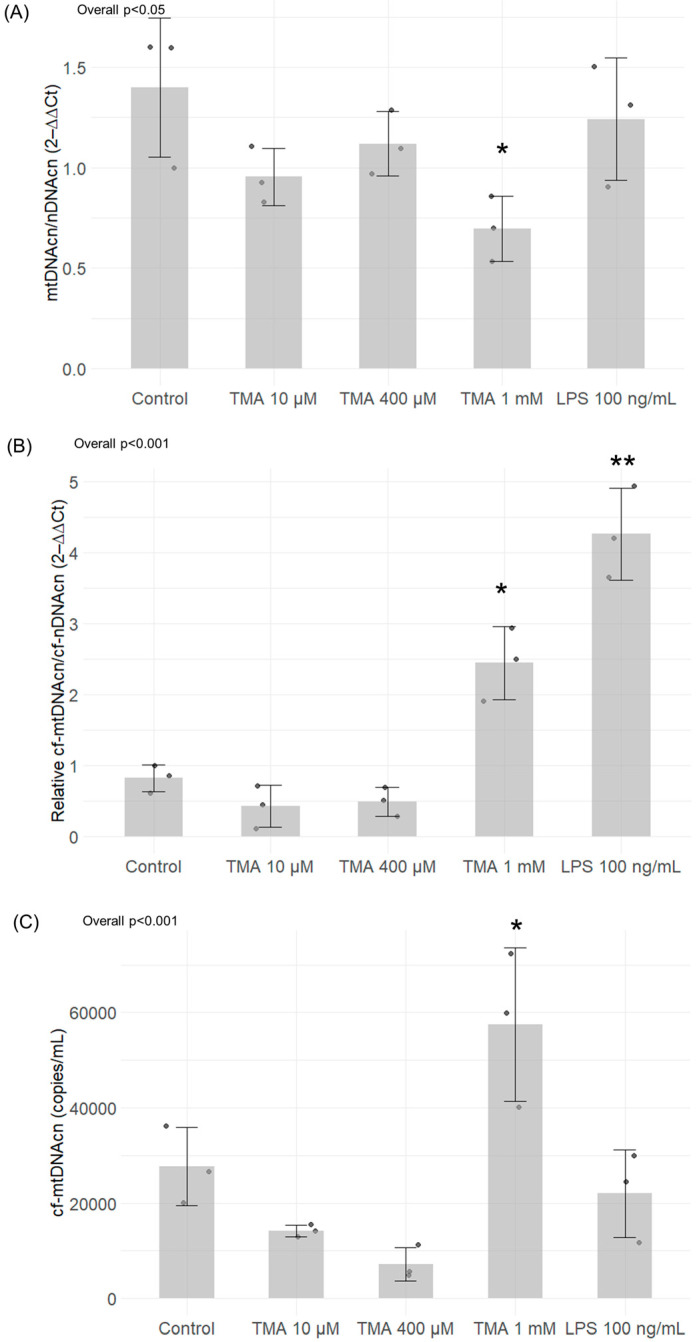
Figure 6.
MtDNA quantification in Caco-2 cells exposed to different concentrations of TMA and in the cell culture medium. Intracellular mtDNAcn (A) and cf-mtDNA released in the culture medium (B,C) were assessed by Caco-2 cells after TMA treatments. Panel (B) shows values of cf-mtDNAcn normalized for cf-nDNAcn, while panel (C) shows the absolute quantification of mtDNAcn/mL of medium. Significant variations in mtDNAcn were observed in the treatment with TMA 1 mM, while neither the lower TMA concentrations nor LPS 100 ng/mL were able to affect intracellular mtDNAcn (A). As for the release of mtDNA from the cell following an induction of the inflammatory condition, the relative quantification analysis revealed a significant increase in cf-mtDNA after exposure to 1 mM TMA and LPS 100 ng/mL (B). The absolute quantification analysis of cf-mtDNAcn by digital PCR confirmed a significant increase in cf-mtDNA only upon TMA 1 mM treatment (C). * p < 0.05; ** p < 0.01 vs. Control.

