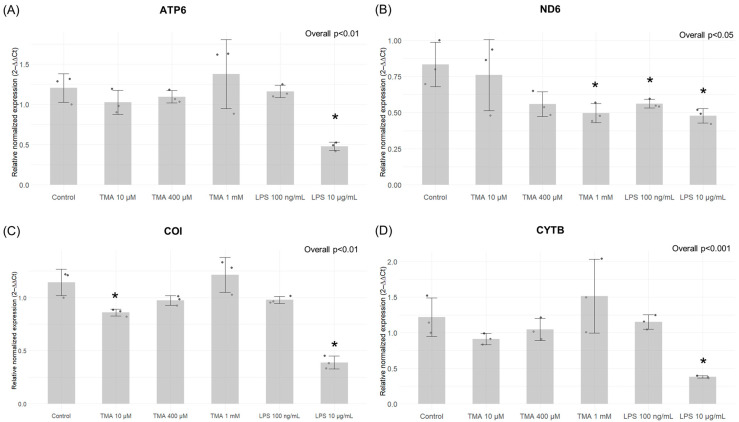
Figure 7.
Expression of mitochondrial genes by qPCR. The gene expression of ATP6 (A), ND6 (B), CO1 (C), CYTB (D) in the different experimental conditions. The expression levels of ND6 significantly decreased with the highest TMA concentration (TMA 1 mM), as well as both LPS treatments (B). Conversely, CO1 showed significant downregulation after treatments with the lowest TMA concentration (TMA 10 µM) and LPS 10 µg/mL (C). The expression levels of ATP6 and CYTB were not affected by TMA treatments but only by LPS 10 µg/mL (A,D). * p < 0.05 vs. Control.

