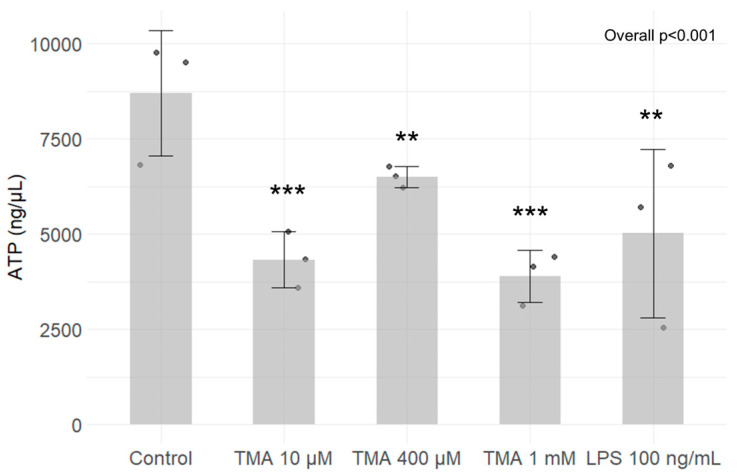
Figure 8.
ATP quantification. ATP levels in Caco-2 cells exposed to different TMA concentrations and LPS (as positive control) was measured using the ATP Colorimetric Assay Kit (Sigma-Aldrich, Germany). A decrease in ATP content was observed for all TMA concentrations tested, as well as exposing cells to 100 ng/mL LPS. ** p < 0.01; *** p < 0.001 vs. Control.

