Figure 2.
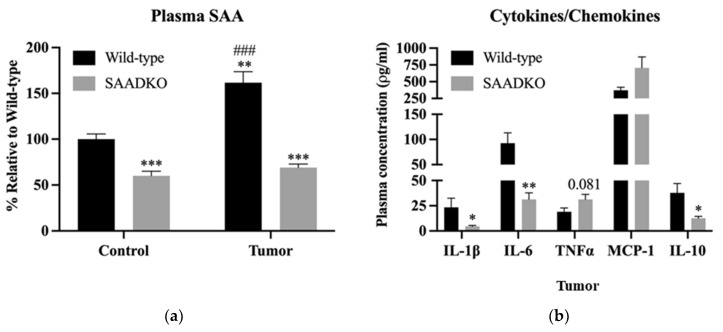
SAADKO mice have lower systemic SAA levels, which influenced pro- and anti-inflammatory signaling. (a) Plasma SAA was analyzed with a full model 2-way ANOVA correcting for multiple comparisons with Tukey. Data show the mean ± SEM (n = 6). ** p < 0.01 control vs. tumor, *** p < 0.001 control vs. tumor, ### p < 0.001 Wild-type Control vs. Wild-type Tumor. Representative Western blot images for plasma SAA can be found in Supplementary File S4 (Figure S11). (b) IL-6 was analyzed with an uncorrected unpaired t-test. MCP-1 was analyzed with an unpaired t-test with Welch’s correction. IL-1β, IL-10, and TNFα were analyzed with a Mann–Witney test. Data show the mean ± SEM (n = 6). * p < 0.05 WT vs. SAADKO, ** p < 0.01 WT vs. SAADKO.

