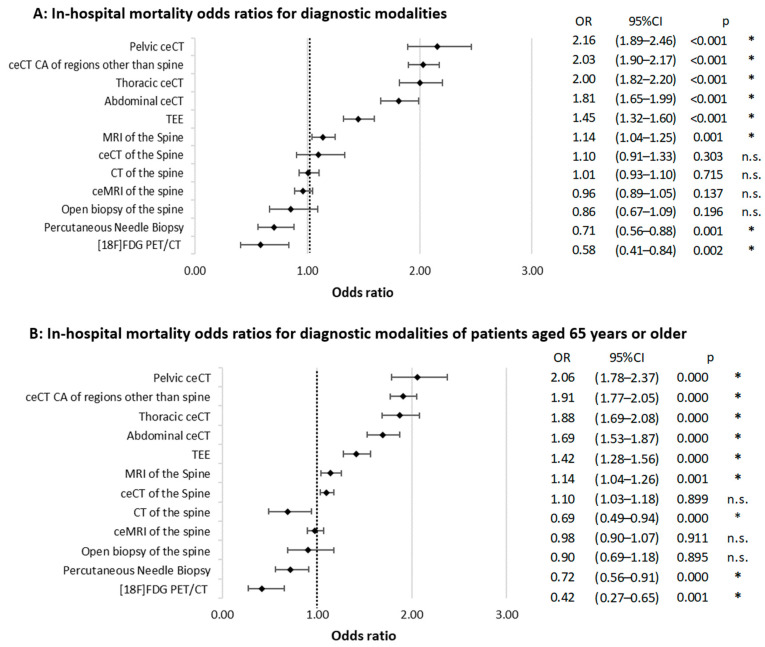
Figure 2.
Odds ratios for in-hospital mortality across diagnostic modalities. Part (A) presents data for the entire patient cohort, while Part (B) focuses on patients aged 65 and older. Whiskers denote the 95% confidence interval (CI), and the dotted line marks an OR of 1.00. p-values are derived from Chi-squared tests. “*” indicates statistical significance (p < 0.05). “n.s.” denotes “not significant”.

