Figure 4.
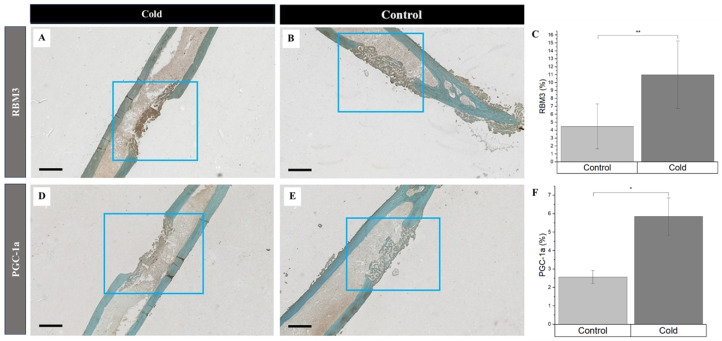
Identification of cold-shock proteins and hypoxia in regenerating bone following cold exposure. PGC-1a (brown), RBM3 (brown), and hypoxia (brown) detection within the cortical defect region (4x magnification). Scale bar represents 500 µm. (A,D) are cold-treated femurs. (B,E) are non-treated femurs serving as a baseline. (C) RBM3 staining expression analysis (n = 8) of positive staining for RBM3 in the control group was 4.47% ± 2.84, while in the experimental group it was 11.0% ± 4.26 (** p-value < 0.008). (F) PGC-1a staining expression analysis (n = 8) of positive staining for PGC-1a in the control group was 2.57% ± 0.36, while in the experimental group it was 5.85% ± 1.01 (* p-value = 0.039).

