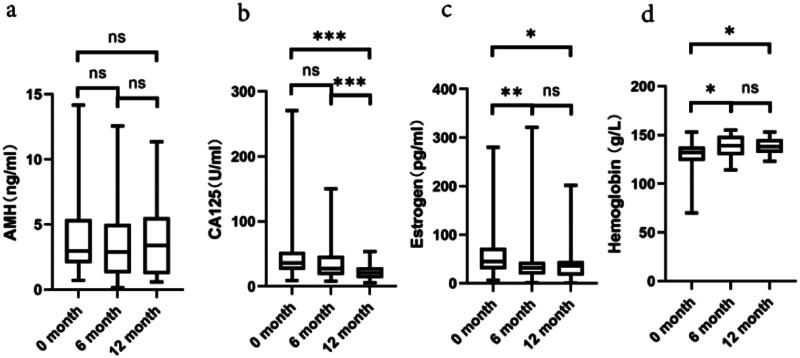
Figure 4.
The data present the changes in AMH, CA125, estrogen, and hemoglobin concentration levels during the dienogest treatment. Throughout the 12-month dienogest treatment, there is no change in AMH levels (a, n = 36). A gradual decline is observed in CA125 levels (b, n = 46). Estrogen levels significantly decreased in the first 6 months and then stabilized (c, n = 39). An increase in hemoglobin concentration is noted, indicating a correction of anemia (d, n = 34). The statistical significance is marked as ns for no significance, * indicates p < .05, ** presents p < .01, and *** demonstrates p < .001.

