Figure 6.
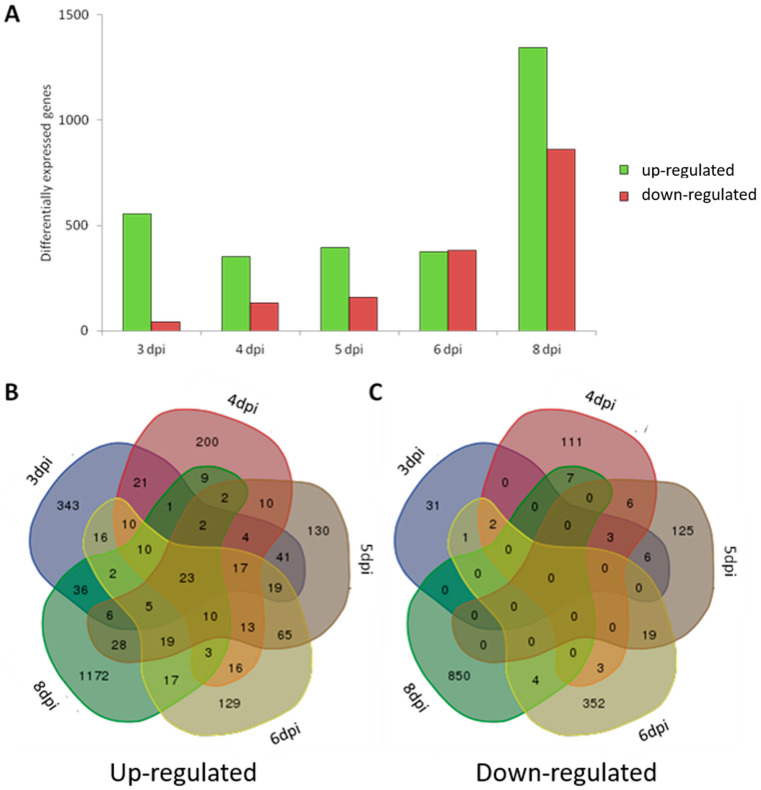
Differentially expressed genes in the time-course infection experiment with Mycobacterium tuberculosis. (A) The total number of significantly differentially expressed genes at 3, 4, 5, 6, and 8 dpi larvae infected with Mycobacterium tuberculosis compared to the PVP-injected control group. Strain H37Rv without a plasmid was used for these experiments. Significance was set to a fold change larger than 2 for up-regulated genes (green bars) or smaller than −2 for down-regulated genes (red bars), with a p value smaller than 0.05. (B,C) Venn diagrams show the overlap of the significantly up-regulated (B) or down-regulated (C) genes between the five time points of mycobacterium infection.

