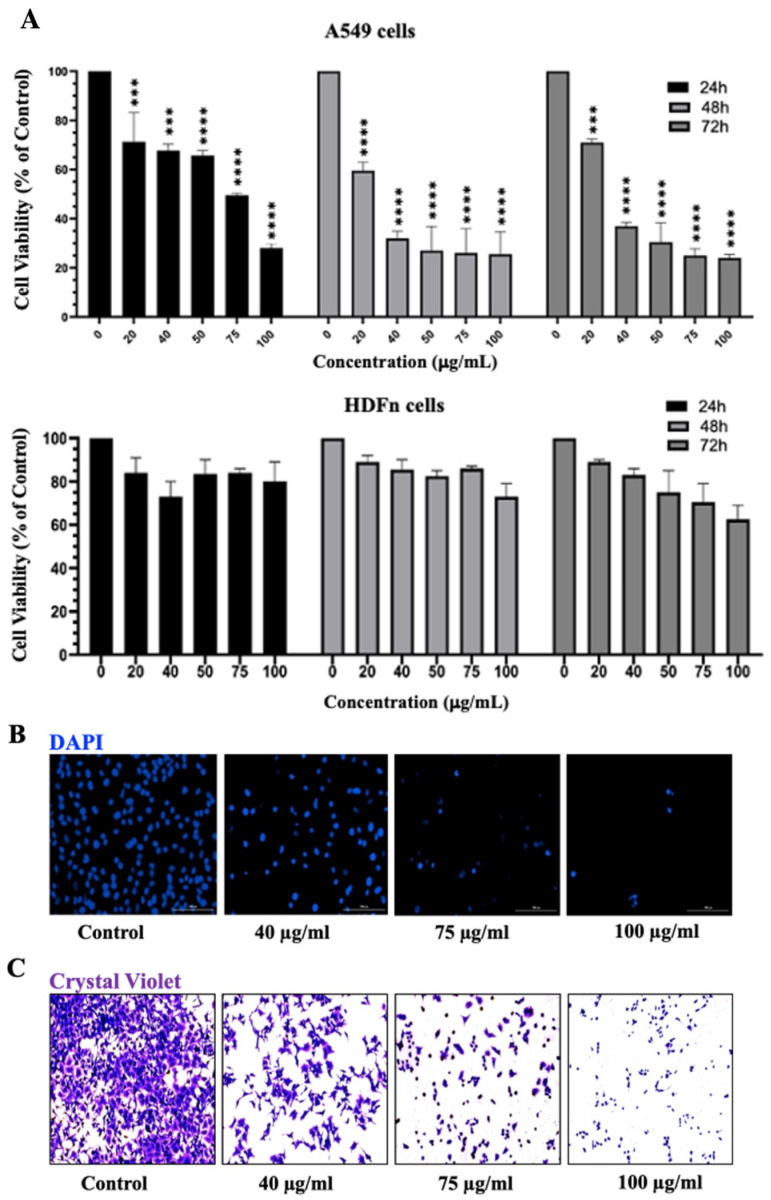
Figure 3.
IVL DCM decreased the viability of A549 cells. (A) MTT assay was used to measure the viability of A549 and HDFn cells treated with the indicated concentrations of IVL DCM for 24, 48, or 72 h. Data represents the mean ± SEM of the percent viability of treated cells compared to vehicle-treated cells. Data are the mean of three independent experiments (n = 3). *** p < 0.001, **** p < 0.0001. (B) A549 cells treated with the indicated concentrations of IVL DCM for 24 h were stained with DAPI nuclear stain. DAPI fluorescence was imaged at 20X magnification using a BioTek Cytation 5 reader. (C) A549 cells were treated with the indicated concentrations of IVL DCM for 24 h and then stained with crystal violet. The micrographs represent stained cells imaged at 20X magnification by light microscopy using the Invitrogen EVOS® FL Cell Imaging System.

