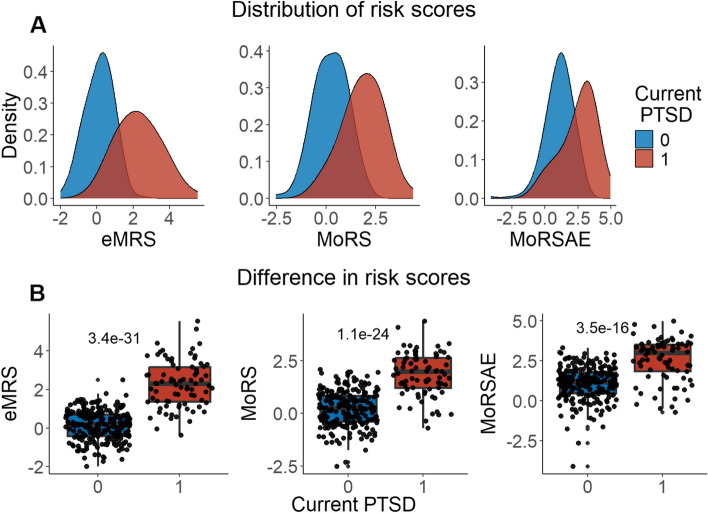
Fig. 2.
Distribution and variation of risk scores between cases and controls in test data (N = 307) in figure legend, 0 is No PTSD and 1 is PTSD. A) The distribution of risk scores for Models 1, 2, and 3 is shown for both cases and controls. B) The difference in risk scores, and associated p value, between cases and controls is displayed. Model 1 calculates exposure and methylation risk scores (eMRS), while Model 2 calculates risk scores based only on methylation variables (MoRS). Model 3 calculates risk scores based on methylation variables adjusted for exposure variables (MoRSAE). The risk scores are higher in PTSD cases compared to controls. The Wilcoxon test confirms a significant difference in risk scores between cases and controls with p < 0.001 for all models (1, 2, and 3)

