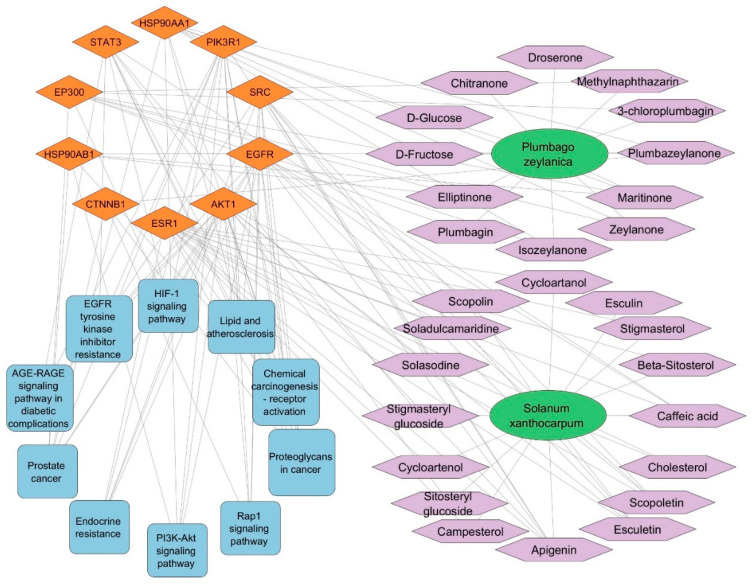
Figure 3.
The SX and PZ phytoconstituents–top 10 targets–pathways network is illustrated as follows: Green elliptical nodes represent SX and PZ, purple hexagon nodes indicate SX and PZ phytoconstituents, orange diamond nodes denote target proteins/genes, and blue round rectangle nodes signify pathways. The edges in the network illustrate the interactions between these nodes.

