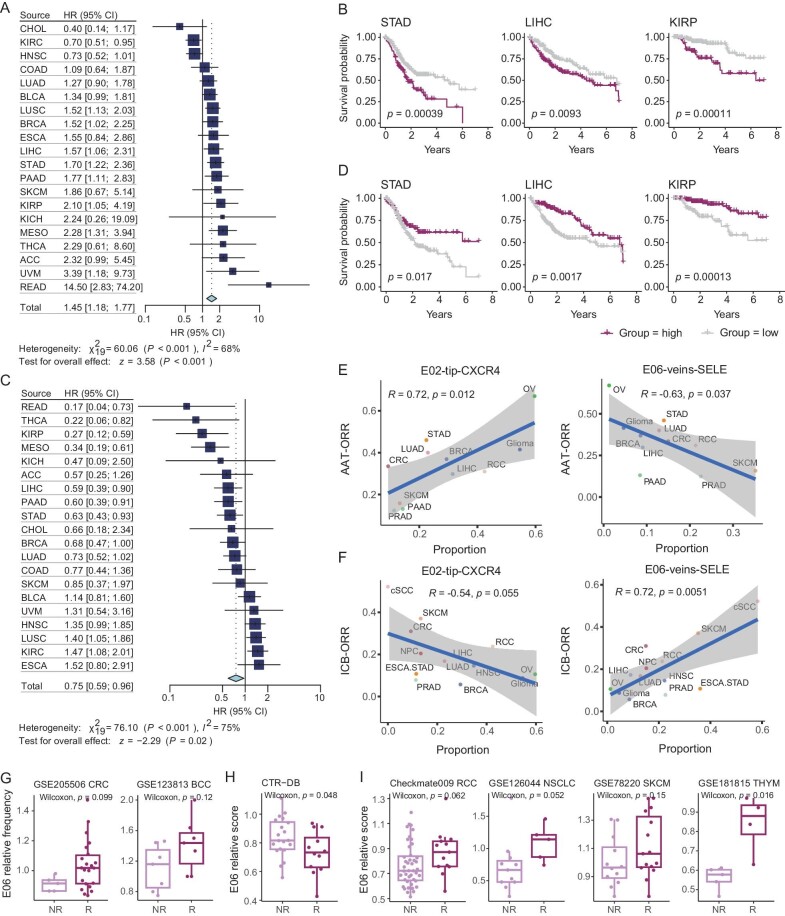
Figure 6.
The relationship between the population structure of TEC and clinical outcomes. (A and C) Forest plots showing the effects of E02-tip-CXCR4 cells (A) and the relative enrichment of E06-veins-SELE cells (C) on overall patient survival of each cancer type and pan-cancer level. The hazard ratios are calculated using Cox regression models with the age, gender, and stage corrected. P values are adjusted by Benjamini–Hochberg. (B and D) Kaplan–Meier plots showing the association of the signature score of E02-tip-CXCR4 cells (B) and the relative enrichment of E06-veins-SELE cells (D) in tumors with prognosis. +, censored observations; log-rank test. (E) Scatterplot showing the correlation of the proportion of E02-tip-CXCR4 cells (left) or E06-veins-SELE cells (right) with the ORR of the anti-angiogenic therapy (AAT) in various cancer types. Pearson correlation test. (F) Scatterplot showing the correlation of the proportion of E02-tip-CXCR4 cells (left) or E06-veins-SELE cells (right) with the ORR of the immune checkpoint blockade (ICB) in various cancer types. Pearson correlation test. (G) Boxplots comparing the E06-veins-SELE relative frequencies between NRs and Rs in ICB-related scRNA-seq datasets. Two-sided unpaired Wilcoxon test. (H and I) Boxplots comparing the E06-veins-SELE relative scores between non-responders (NRs) and responders (Rs) in AAT (H) and ICB (I) related datasets. Two-sided unpaired Wilcoxon test.

