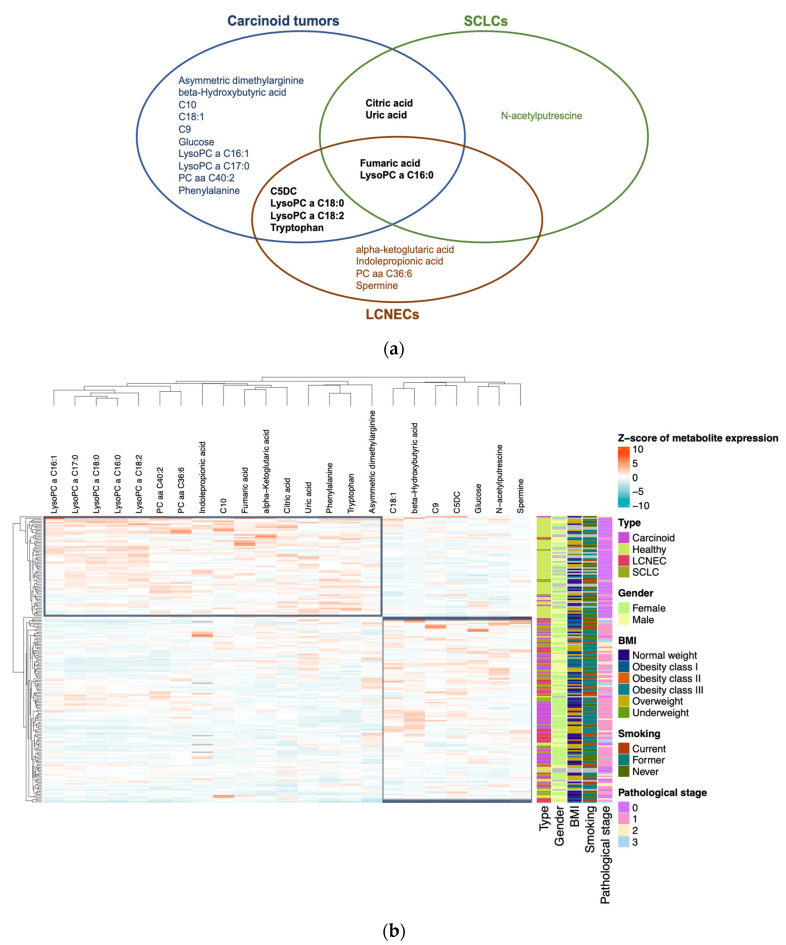
Figure 2.
Representation of variations in concentrations of metabolites differentially expressed in plasma under different conditions and characterization of their discriminative capacity: (a) Venn diagram of the 23 metabolites that have significantly different concentrations between patients with carcinoid tumors, SCLCs, and LCNECs compared to healthy individuals. (b) Heatmap plot with plasma concentrations of these 23 metabolites. Concentrations were normalized by z-score. Clinical characteristics are integrated: gender, BMI, smoking, and pathological stage.

