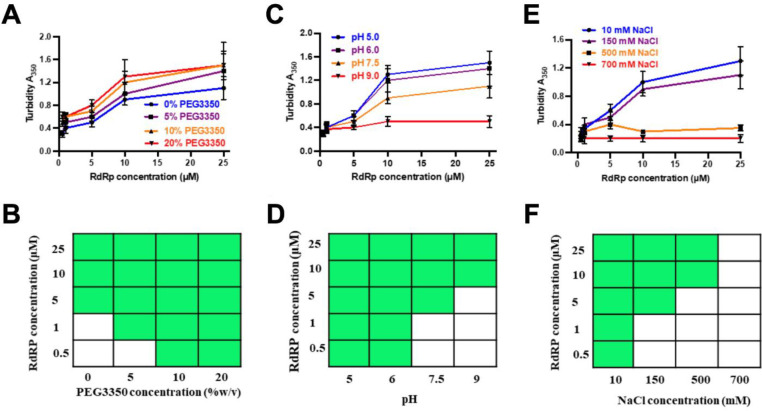
Figure 3. Phase separation of GII.4 RdRp is modulated by PEG3350 concentration, pH, and salt concentration.
Effect of (A) protein and PEG3350 concentrations, (B) protein concentrations and pH, (C) protein and salt concentrations on the phase separation of RdRp was assessed by measuring the turbidity of the samples at OD 350 nm. (D-F) A phase diagram of RdRp at (D) protein and PEG3350 concentrations, (E) at protein concentrations and pH, at (F) protein and salt concentrations constructed from the confocal microscopy images. The green boxes indicate LLPS (condensate state), and the white boxes indicate no LLPS (soluble state).

