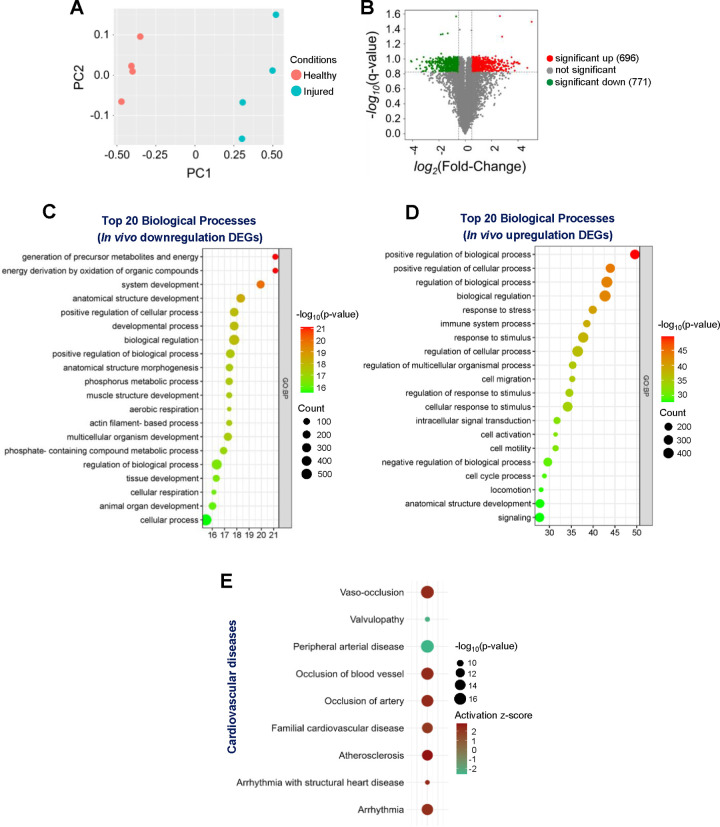
Figure 2. Structure and function of genome-wide transcriptomic changes due to vascular injury.
(A) Principal Component Analysis (PCA) plot for the entire transcriptome list displays the correlations and variances among the samples. (B) Volcano plot illustrates the distribution of differentially expressed genes (DEGs) in response to femoral artery fine-wire injury. Green dots represent statistically downregulated genes (771 downregulated DEGs identified) and red dots represent statistically upregulated genes (696 upregulated DEGs identified). Bubble plots depict the top 20 enriched biological processes for significantly (C) downregulated and (D) upregulated DEGs. (E) Cardiovascular Disease terms were predicted by IPA to be activated in response to vascular injury.

