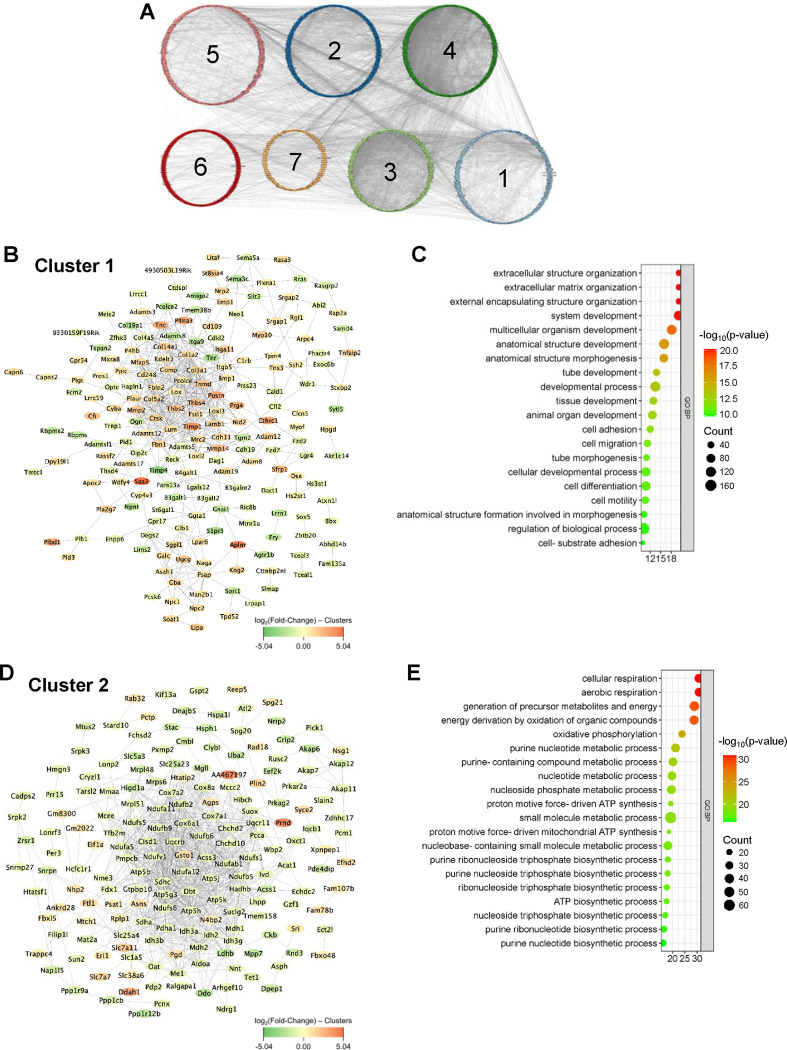
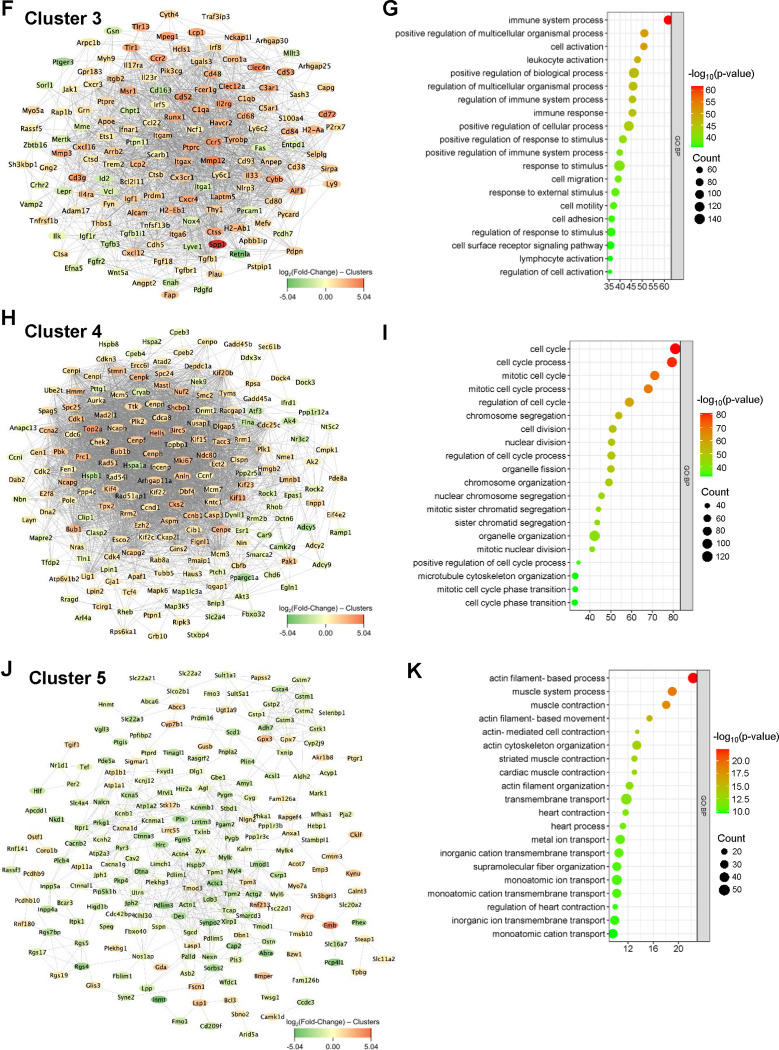
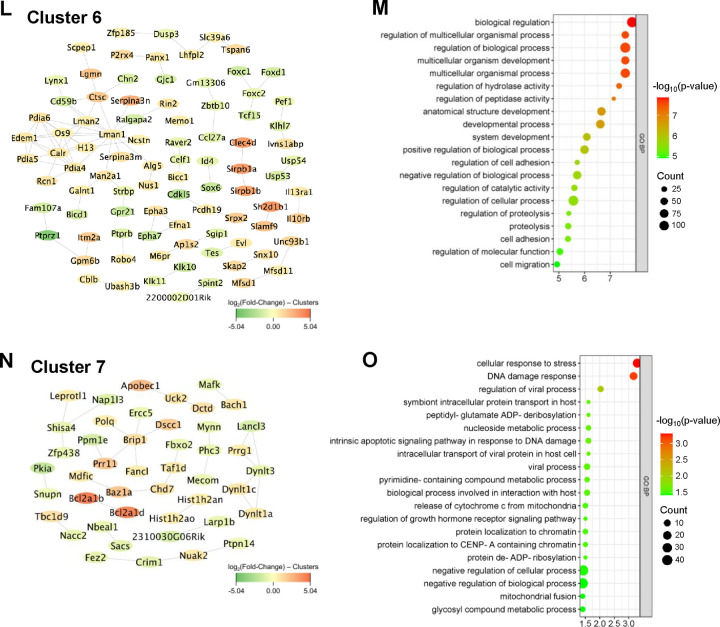
Figure 3. K-means clustering analysis and GO enrichment.
(A) Network displays 7 clusters within the protein-protein interaction network (1,188 nodes and 11,025 edges) of DEGs based on k-means clustering. (B-C) Interaction network of cluster 1 (193 nodes and 533 edges) and its associated biological processes including extracellular matrix organization, extracellular structure organization, and external encapsulating structure organization. (D-E) Interaction network of cluster 2 (177 nodes and 900 edges) and its associated biological processes including cellular respiration, aerobic respiration, and generation of precursor metabolites and energy. (F-G) Interaction network of cluster 3 (151 nodes and 1,728 edges) and its associated biological processes including immune system process, positive regulation of multicellular organismal process, and cell activation. (H-I) Interaction network of cluster 4 (189 nodes and 3,713 edges) and its associated biological processes including cell cycle, cell cycle process, and mitotic cell cycle. (J-K) Interaction network of cluster 5 (216 nodes and 584 edges) and its associated biological processes including actin filament-based process, muscle system process, and muscle contraction. (L-M) Interaction network of cluster 6 (89 nodes and 88 edges) and its associated biological processes including biological regulation, regulation of multicellular organismal process, and regulation of biological process. (N-O) Interaction network of cluster 7 (45 nodes and 33 edges) and its associated biological processes including cellular response to stress, DNA damage response, and regulation of viral process.


