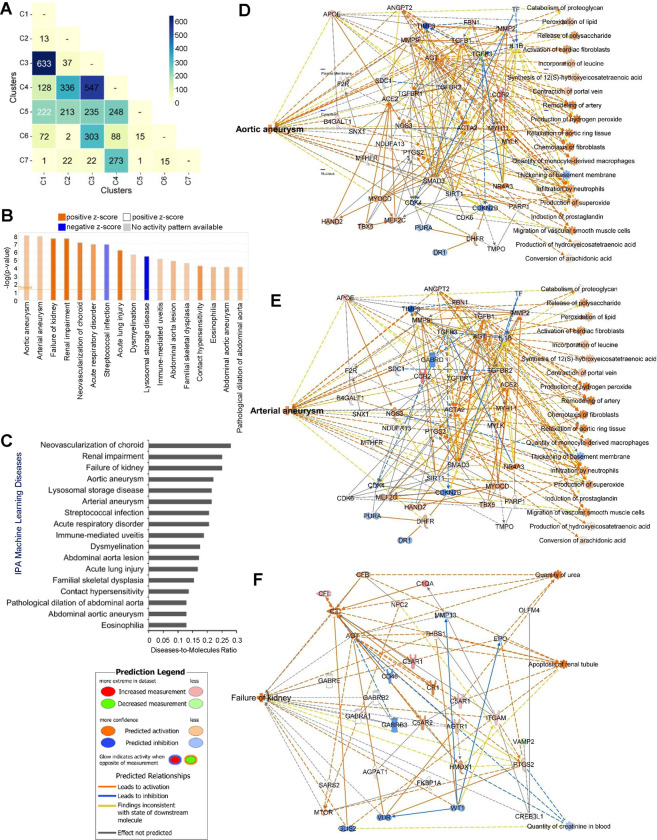
Figure 4. Inter-cluster analysis of diseases and pathways associated with cluster 1 and 3.
(A) Matrix correlation heatmap illustrates molecular communications between each pair of functionally distinct clusters. (B) IPA Core Analysis on cluster 1 and 3 DEGs showing differential changes in various Machine Learning (ML) Disease Pathways. (C) Bar plot shows the disease-to-molecules ratio of differentially and significantly changed ML Disease Pathways. Interaction networks display molecular communications and functionalities leading to changes in ML Disease Pathways of (D) aortic aneurysm, (E) arterial aneurysm, and (F) failure of kidney.

