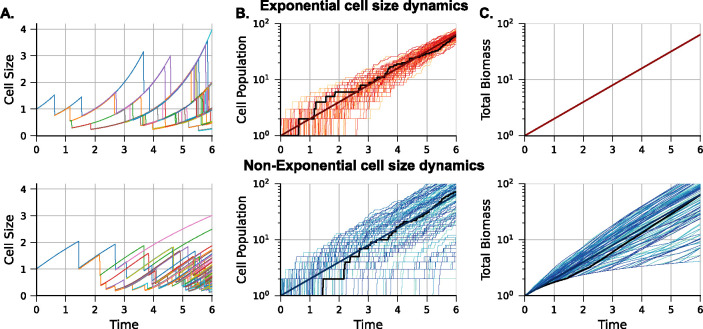
Figure 3: Illustration of sample trajectories for cell size, clonal population size, and total biomass for exponential and non-exponential cell size dynamics, with cell division timing set according to the adder.
(A) (top panel) Cell size dynamics for exponentially and (bottom panel) non-exponentially growing cells within a proliferating colony. Different colors represent different descendants of the colony progenitor. In both cases, size control follows the adder model, where the size added () in each cell cycle is an independent and identically distributed random variable following an exponential distribution with and . (B) Examples of clonal population size over time for simulated colonies. Each colony starts with a newborn progenitor cell with size a.u. The black line represents the colony in (A), and the dark red line is the mean population number. The y-axis is on a logarithmic scale. (C) Total colony biomass, defined as the sum of the cell sizes of all descendant cells at a given time. When all colonies start with the same-sized progenitor, the biomass is given by (13). For the exponential case (top panel), the total biomass does not vary across colony replicas, while for the nonexponential case (bottom panel), biomass shows considerable inter-colony differences.

