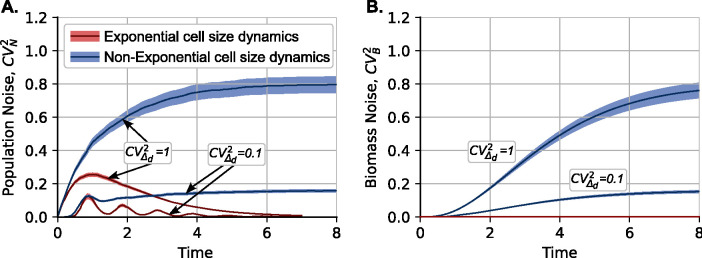
Figure 4: Cell size dynamics qualitatively impact the stochastic dynamics of clonal population size.
(A) Plot of the squared coefficient of variation of clonal size () over time for cell size dynamics following exponential and non-exponential growth laws as described in Figure 3. In all cases, cell size homeostasis occurs according to the adder model, with following a gamma distribution with and two values of corresponding to high noise and low noise . For exponential cell size dynamics, exhibits a transient peak and then approaches zero as . In stark contrast, increases over time to asymptotically approach a non-zero value for non-exponential cell size dynamics. Lowering the noise in the added size results in lower values of . (B) Plot of the squared coefficient of variation of total biomass, i.e., the aggregated size of all cells in a colony. For the exponential case, due to (13), while monotonically increases over time in the non-exponential case, exhibiting similar asymptotic values to . All coefficients of variation are computed based on 5000 colony replicas, with colored regions representing the 95% confidence interval obtained using bootstrapping.

